1. Introduction
For response to recently reinforced environmental regulations, research has been conducted on the development of muffler modules for filtering the exhaust gas inevitably generated by the operation of internal combustion engines. In particular, since diesel engines for heavy machinery have a high degree of exhaust gas pollution depending on the displacement, a diesel particulate filter (DPF) that filters the particulate matter or soot generated by incomplete combustion must be installed in the muffler
1). DPFs that have been mass-produced or developed thus far were designed to be detachable and attachable using the flange-up method that fastens each part with a clamp. Since most assembly processes in the muffler manufacturing process require welding, however, excellent mechanical properties, such as high tensile and fatigue properties, are required for the welded joint during the design of a muffler module considering the extreme environment and repeated loads of transport equipment
2,3). When dissimilar materials with different thicknesses are subjected to lap joint, the access of the welding torch is difficult due to the limited work environment, and it is also difficult to secure stability for the quality and mechanical properties of the welded joint due to the complex design structure with a large difference in thickness between the upper and lower materials. In particular, since welding defects including fracture in the welded joint, which cause poor tensile strength, are increasing, it is necessary to derive optimal welding conditions to address such defects
4,5). Therefore, this study aimed to derive the optimal welding conditions that satisfy the tensile properties of the single lap jointed dissimilar combination with a thickness ratio of 4:1 for muffler module welding as well as the critical bead geometry for securing excellent weld quality by conducting regression analysis and ANSYS simulation to identify bead geometry factors that affect tensile strength. First, correlations between major weld bead geometry factors and tensile strength were analyzed using regression analysis, and then ANSYS analysis was conducted to verify the relationships between the fracture location and the weld bead geometry factors during the tensile test.
2. Experimental Method
2.1 Experimental materials and equipment
The dissimilar combination materials used in this study were 8.0mm-thick SS400 and 2.0mm-thick SUS439, which have been used in muffler modules. SF-436 with a diameter of 1.2 mm was used as a filler for bonding the two plates.
Table 1 shows the chemical compositions of the materials and filler used in this study. The welding equipment used in this study was TPS4000 from Fronius, and automated single lap joint was performed using a 6-axis robot. When dissimilar combination welding specimens were prepared, the contact tip to work distance (CTWD) was fixed at 15 mm and the torch angle at 55┬░. 100% Ar gas was constantly supplied at 20 L/min as protective gas. The current, speed, and teaching position (T.P) were only selected as welding parameters.
Fig. 1 shows the arc welding equipment for the experiment. To derive the optimal welding conditions, welding conditions were set using the current and speed values within the ┬▒15% range under the single lap joint conditions used in the field.
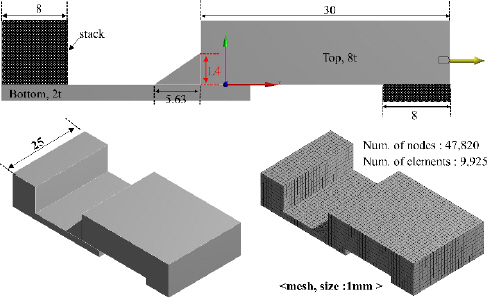
Fig. 2 shows the dimensions of the plates for single lap joint and the location of T.P. T.P was moved in the thickness direction of the upper plate to secure the proper bonded area of the thick upper plate. The T.P=0 condition represents that the teaching of the wire is applied to the location where the upper and bottom plates are bonded, whereas the T.P=1 condition indicates that the teaching of the welding torch is lifted by 1 mm in the thickness direction of the upper plate from the bottom plate surface. In this study, 18 welding condition combinations created by combining the current, speed, and T.P conditions were used to obtain the weld bead geometry as shown in
Table 2.
Table┬Ā1
Chemical compositions of used material and welding wire (wt. %)
|
C |
Si |
Mn |
P |
S |
Cr |
Mo |
Ti |
|
SUS439(Bottom) |
<0.12 |
<0.75 |
<1.0 |
<0.04 |
<0.03 |
16-18 |
|
|
|
SS400(Upper) |
0.18 |
0.14 |
0.54 |
0.050 |
0.050 |
|
|
|
|
SF-436(Filler) |
0.03 |
0.60 |
0.40 |
0.008 |
0.010 |
16.8 |
0.78 |
0.45 |
Fig.┬Ā1
Welding device set-up for the experiment
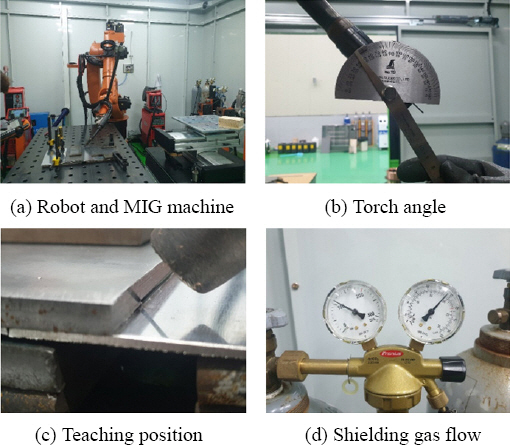
Fig.┬Ā2
Specification of lap joint welding specimen

Table┬Ā2
Variable for experimental design
|
Level (-) |
Level (0) |
Level (+) |
|
Teaching position (mm) |
0 |
|
1 |
|
Current (A) |
140 |
155 |
170 |
|
Speed (mm/s) |
7 |
9 |
11 |
2.2 Tensile strength evaluation and bead cross-section analysis
As for arc welding for the tensile test and weld bead geometry analysis, single lap joint was performed after overlapping 300 ├Ś 300mm materials by 25 mm as shown in
Fig. 2. For the shear tensile test, specimens were prepared in accordance with KS B 0802(2003)
6), and then the test was repeated four times under each welding condition. The final fracture location was defined as the location where fracture occurred three times or more after the tensile test. For the weld bead cross-section analysis, the welded joint collected from the center of the specimen under each welding condition was precisely cut and polished with sandpaper, and then observed using a microscope after 3% nital etching (HNO
3 3 mL + ethic alcohol 97 mL).
Fig. 3 shows geometry factors for the bead cross-section geometry that varies depending on the welding parameters in single lap joint
7,8). The dimensions of the selected geometry factors were captured using a microscope, and then the Image-Pro plus software was used.
Fig.┬Ā3
Nomenclature of the weld bead

2.3 Regression analysis
Regression analysis refers to a statistical analysis method in which a mathematical model is assumed to identify the effects of independent variables on dependent variables, and this model is predicted from the data of the measured variables
9). The regression analysis used in this study utilized MINITAB 19, a statistical analysis software program. The current, speed, and T.P were selected as independent variables that affect dependent variables, i.e. the weld bead geometry factors. Main effects plot analysis was also conducted to identify the main factors that affect the six geometry factors (dependent variables) according to the change in the levels of the independent variables
10,11). The main effects plot is frequently used to identify the effect of one or more categorical factors on the quantitative response. The main effects plot parallel to the x-axis means that there is no effect, and the size of the main effect increases as the slope of the plot increases
11). In addition, fitted line plot analysis was conducted among the regression analysis methods to derive the correlation between each dimension of the weld bead geometry and tensile strength. Fitted line plot analysis is suitable for expressing the relationship between a quantitative predictor and response, and its result is determined valid when R
2 is 95% or higher or when the P-value is 0.05 or less
10). Since the value of R
2 increases as the number of variables and the amount of data increase
11,12), it was excluded in terms of judgment in this study.
2.4 ANSYS simulation
ANSYS simulation analysis was conducted to examine the correlation between the weld bead geometry and tensile strength based on the results derived through an actual experiment. The boundary condition was set, in which the filler is bonded to the upper and bottom plates. As for load conditions, under the condition that the bottom plate was fixed, when the opposite surface of the fixed part was moved by the enforced displacement in the X-axis direction using the displacement condition, the displacement value that reached the maximum tensile strength of the upper plate, bottom plate, and filler was examined and the condition that exceeded the ultimate tensile strength (UTS) at the shortest displacement was predicted as a fracture location. During the analysis, the Y- and Z-axis values were set to zero to assume that there was no movement except in the X-axis direction, and the occurrence of bending deformation due to the thickness ratio (4:1) was prevented using the stack.
Fig. 4 and
Table 3 show the schematic of the tensile specimen and the properties of the materials used for the analysis.
Fig.┬Ā4
Schematic of tensile specimen and mesh for ANSYS simulation
Table┬Ā3
Value of material physical properties for ANSYS simulation
|
SF-436 (Filler) |
SS400 (Upper) |
SUS439 (Bottom) |
|
Density (kg/m3) |
7800 |
7850 |
7695 |
|
Tensile strength (MPa) |
392 |
400 |
455 |
|
YoungŌĆÖs modulus (GPa) |
200 |
210 |
193 |
|
PoissonŌĆÖs ratio |
0.3 |
0.3 |
0.29 |
3. Experiment Results and Discussion
3.1 Analysis of bead geometry factors for single lap joint
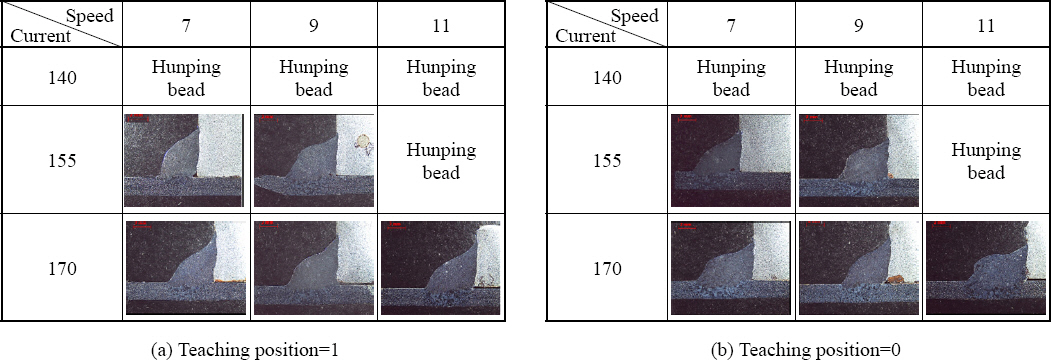
Fig. 5 shows the cross-section bead geometry obtained by performing welding under the conditions in
Table 2. Regardless of T.P, when the current was 140 A, a humping bead, which is the condition of insufficient penetration, was observed in the weld speed range used in the experiment. When it was 155 A, a humping bead was observed only at a high speed of 11 mm/s. Except for the conditions in which a humping bead was generated, excellent bead geometry was obtained in all combinations of welding conditions. It was observed, however, that not all the areas of the upper plate SS400 with a thickness of 8t were bonded in the thickness direction. It appears that some non-jointed areas existed in the upper plate because the welding condition was selected to prevent burn through by overheating, which occurs in the relatively thin bottom plate when trying the penetration of the area in the thickness direction of the upper plate in the plate combination with a thickness ratio of 4:1
12).
Table 4 shows the results of measuring the dimensions of the bead geometry factors for excellent welds shown in
Fig. 3, excluding welding conditions that exhibited humping beads (measurement locations: L1-L5, ╬Ė).
Table┬Ā4
Results of dimension for bead geometry according to welding parameters
|
Case No. |
Welding parameter |
Bead geometry |
|
Current |
Speed |
Teaching position |
L1 |
L2 |
L3 |
L4 |
L5 |
╬Ė |
|
1 |
155 |
7 |
1 |
2.01 |
7.01 |
3.34 |
5.51 |
4.24 |
102.3 |
|
2 |
155 |
9 |
1 |
0.89 |
7.66 |
3.65 |
4.69 |
6.03 |
134.1 |
|
3 |
170 |
7 |
1 |
0.32 |
7.85 |
3.87 |
5.76 |
5.28 |
131.1 |
|
4 |
170 |
9 |
1 |
0.62 |
8.05 |
3.88 |
5.47 |
5.71 |
131.1 |
|
5 |
170 |
11 |
1 |
0.48 |
8.77 |
4.13 |
6.30 |
5.69 |
121.9 |
|
6 |
155 |
7 |
0 |
0.60 |
6.96 |
3.49 |
4.56 |
5.36 |
125.9 |
|
7 |
155 |
9 |
0 |
1.03 |
7.23 |
3.43 |
4.52 |
5.55 |
112.6 |
|
8 |
170 |
7 |
0 |
0.85 |
8.30 |
3.79 |
4.82 |
6.53 |
134.2 |
|
9 |
170 |
9 |
0 |
0.59 |
7.57 |
3.65 |
5.12 |
5.36 |
129.0 |
|
10 |
170 |
11 |
0 |
1.20 |
7.94 |
3.35 |
4.03 |
6.60 |
121.6 |
For ten welding condition cases with excellent welds, which were determined through the observation of the weld bead geometry in
Fig. 5, the tensile strength of the welded joint and the fracture location after the tensile test are shown in
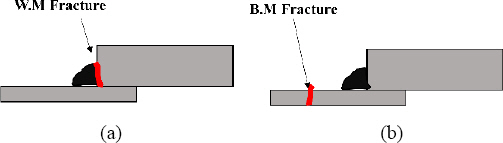
Table 5. As for the fracture location expressed in
Table 5, the base metal (B.M) fracture means the fracture that occurred in the bottom SUS439 material, and the weld metal (W.M) fracture was defined as the fracture that occurred at the boundary between the filler and the upper plate of SS400 as shown in
Fig. 6. As can be seen from the table, for cases 1 to 5 (T.P=1), fracture mostly occurred in B.M except for case 2, and the tensile strength was 410 MPa or higher. In some experiment results, W.M fracture was observed, and the tensile strength ranged from 330 to 400 MPa, which were slightly lower compared to the tensile strength values obtained when B.M fracture occurred. For cases 6 to 10 (T.P=0), on the other hand, fracture mostly occurred in W.M and the tensile strength ranged from 200 to 300 MPa, which were significantly lower compared to the tensile strength obtained when B.M fracture occurred.
Fig.┬Ā5
Results of cross-section bead geometry for MIG welded dissimilar combination, (a) T.P = 1, (b) T.P = 0
Table┬Ā5
Results of tensile strength and fracture location
|
Case No. |
Welding parameter |
Tensile strength (MPa) / Fracture location |
|
Current |
Speed |
Teaching position |
Test 1 |
Test 2 |
Test 3 |
Test 4 |
|
1 |
155 |
7 |
1 |
419 |
B.M |
420 |
B.M |
420 |
B.M |
417 |
B.M |
|
2 |
155 |
9 |
330 |
W.M |
353 |
W.M |
378 |
W.M |
345 |
W.M |
|
3 |
170 |
7 |
428 |
B.M |
423 |
W.M |
427 |
B.M |
427 |
B.M |
|
4 |
170 |
9 |
419 |
B.M |
420 |
B.M |
419 |
B.M |
360 |
W.M |
|
5 |
170 |
11 |
418 |
B.M |
420 |
B.M |
409 |
B.M |
337 |
W.M |
|
6 |
155 |
7 |
0 |
275 |
W.M |
286 |
W.M |
377 |
W.M |
307 |
W.M |
|
7 |
155 |
9 |
235 |
W.M |
288 |
W.M |
267 |
W.M |
314 |
W.M |
|
8 |
170 |
7 |
422 |
B.M |
401 |
W.M |
312 |
W.M |
306 |
W.M |
|
9 |
170 |
9 |
427 |
W.M |
368 |
W.M |
336 |
W.M |
361 |
W.M |
|
10 |
170 |
11 |
279 |
W.M |
310 |
W.M |
255 |
W.M |
391 |
W.M |
Fig.┬Ā6
Schematic of fracture location after tensile strength test, (a) weld metal fracture, (b) base metal fracture
As for main factors that affect the tensile strength of the welded joint during arc welding, the bead geometry is a representative factor and the bonded area is known to have a direct impact
13,14). The results of
Fig. 5 and
Table 5 indicate that the fracture location and tensile strength vary depending on T.P among the other welding parameters. In the case of the welding conditions that caused W.M fracture, fracture occurred at the interface between SS400 and filler. This indicates that L4 in
Table 4, which represents the length of the bonded area between SS400 and filler, can have an influence among the other bead geometry factors. L5, which is the length of the bonded area between SUS439 and filler, is also judged to be a main factor that affects the tensile strength, but its value was mostly equal to or higher than that of L4, indicating that fracture mostly occurred at the interface between SS400 and filler. When the conditions that caused fracture and the L4 value were compared through the results in
Tables 4 and
5, it was found that the length of L4 was higher than 5.5 mm. B.M fracture or W.M fracture occurred when L4 was higher than 4.8 mm, and W.M fracture occurred when it was lower than 4.8. In other words, it appears that B.M fracture may occur rather than W.M fracture when the length of L4 is higher than 68% of the thickness of the upper base metal (8 mm). From section 3.2, an attempt was made to identify welding parameters that determine the bead geometry factors through basic linear regression analysis using the values of the bead geometry factors obtained from the experiment and to examine the relationship among the tensile strength, fracture location, and bead geometry factors obtained through this study.
3.2 Correlation derivation through regression analysis
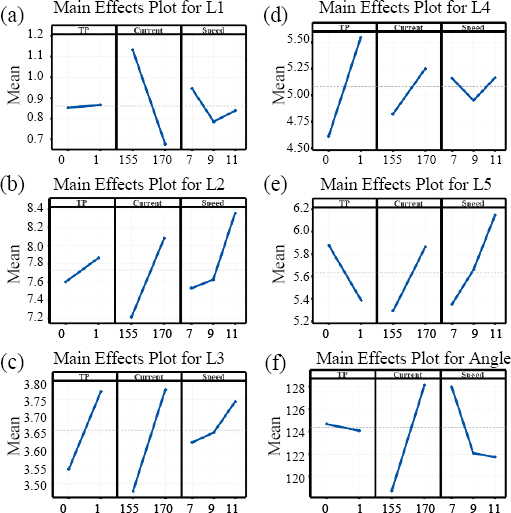
First, the results of the main effects plot analysis are shown in
Fig. 7 to identify the welding parameters (independent variables) that affect the dimension of each weld bead geometry factor. Under the experimental conditions of this study, most of the weld bead dimensions tended to be proportional or inversely proportional to the current or speed. It was confirmed, however, that L4 is affected by T.P rather than the current and speed. It was also observed that the length of L4 showed a tendency to increase as T.P was lifted by 1 mm in the thickness direction of the upper plate from the bottom plate, and this was in agreement with the results in
Table 4. This appears to be because the arc heat source first generated in the upper plate melted the upper plate, and the melt pool flew in the direction of gravity during welding. The other bead geometry factors are judged to be more affected by the current or speed than the level of T.P. In general, the main factors that determine the bead geometry are the current and speed, but only L4 was more affected by T.P in this study because T.P by the thickness ratio was selected as a parameter.
Fig.┬Ā7
Main effect of input variable on each dimension of bead geometry, (a) L1, (b) L2, (c) L3, (d) L4, (e) L5, (f) ╬Ė
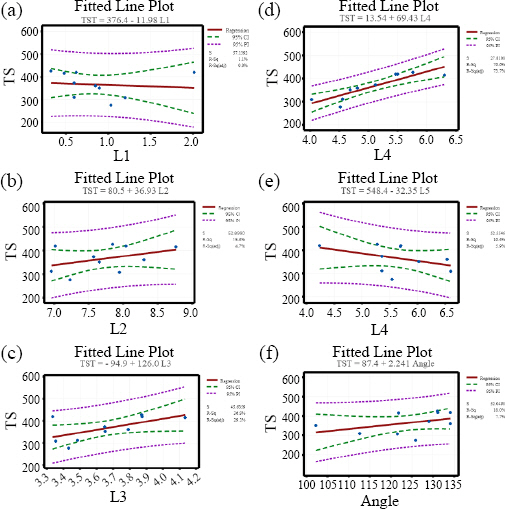
Next, the results of the fitted line plot analysisare shown in
Fig. 8 to derive the correlations between the weld bead geometry factors and tensile strength. Under the experimental conditions of this study, the correlations between all the dimensions, except for L4, and tensile strength exhibited a P-value of 0.05 or higher, indicating that they are not highly correlated with the change in tensile strength. In the case of L4, the P-value was valid as it was 0.001, and R
2 also showed a high value of more than 75%. This indicates that there is a general linear relationship between L4 and tensile strength. This appears to be because the length of L5 is equal to or higher than that of L4, which are factors that may affect the tensile strength, and thus the influence of L4 is larger as mentioned earlier on the actual weld bead geometry. When the relationship among the weld bead geometry factors, tensile strength, and fracture location was analyzed through regression analysis, it was found that there is a linear relationship between L4 and tensile strength compared to other geometry factors. Through the actual tensile strength results and regression analysis, it was verified that, for the L4, the fracture location started to change at the L4 of 5.6 mm, which corresponds to 68% of the thickness of the upper base metal (8 mm). ANSYS analysis was conducted to investigate the reason.
Fig.┬Ā8
Fitted line plot of each dimension of bead geometry affected the tensile strength, (a) L1, (b) L2, (c) L3, (d) L4, (e) L5, (f) ╬Ė
3.3 Verification of the correlation between the bead and tensile strength through ANSYS analysis
ANSYS simulation was performed to verify the relationship among the tensile strength, fracture location, and L4, among the other bead geometry factors. For the simulation, only the L4 length was set as a variable, and a total of four cases were selected from 4 to 6.4 mm at 0.8mm intervals. The other weld bead geometry factors were fixed.
Fig. 9 and
Table 6 show the fracture location according to the change in L4 obtained using ANSYS simulation. For the bottom plate, the tensile strength reached the UTS of the bottom plate (455 MPa) when the displacement was 0.03 mm or higher for cases 1 and 2 and when it was lower than 0.03 mm for cases 3 and 4. For the upper plate, UTS was reached when the displacement of 0.06 mm occurred for all cases. In the case of the filler, its UTS (392 MPa) was reached when the displacement was less than 0.03 mm for cases 1 and 2 and when it exceeded 0.03 mm for cases 3 and 4. These results confirmed that the shortest displacement was exhibited at the filler for cases 1 and 2 and at the bottom plate for cases 3 and 4. In other words, it can be judged that fracture first occurs in the filler for cases 1 and 2 where L4 is 4.8 mm or less and in the bottom plate for cases 3 and 4 where L4 is 5.6 mm or higher. When the relationship among the L4 length, tensile strength, and fracture location was examined through ANSYS analysis, it was found that W.M fracture occurred when L4 was 4.8 mm or less and B.M fracture when L4 was 5.6 mm or higher. This indicates that the critical L4 length is between 4.8 and 5.6 mm.
Fig.┬Ā9
Representative image of minimum stress and displacement of each material after tensile ANSYS simulation

Table┬Ā6
Value and location of minimum displacement for fracture according to changes L4 dimension
|
Minimum displacement for fracture [mm] |
Initial fracture location |
|
Bottom (SUS 439) |
Top (SS400) |
Filler (SF-436) |
|
CASE 1 (L4 = 4.0mm) |
0.0308 |
0.0663 |
0.0271 |
Filler (SF436) |
|
CASE 2 (L4 = 4.8mm) |
0.0303 |
0.0667 |
0.0280 |
Filler (SF436) |
|
CASE 3 (L4 = 5.6mm) |
0.0299 |
0.0671 |
0.0302 |
Bottom (SUS 439) |
|
CASE 4 (L4 = 6.4mm) |
0.0297 |
0.0674 |
0.0312 |
Bottom (SUS 439) |
4. Conclusion
For the metal inert gas (MIG) welding of the SS400 (8t) and SUS 439 (2t) dissimilar combination with a thickness ratio of 4:1, the correlation between the weld bead and tensile strength was examined through regression analysis and ANSYS analysis in this study. The results are as follows.
1) When the teaching position (T.P) was 1 mm from the bottom plate, conditions that satisfied more than 400 MPa were derived. When T.P was zero, fracture occurred in the weld metal (W.M) and the tensile strength was not satisfied.
2) As for regression analysis to examine the correlation between the L4 length and tensile strength, it was confirmed through the main effects plot that the L4 length, among the bead geometry factors, is most affected by the change in T.P. The results of fitted line plot analysis also confirmed that the change in L4 has the largest impact on the change in tensile strength.
3) When the relationship among the L4 length, tensile strength, and fracture location was examined through ANSYS analysis, it was found that W.M fracture occurred when L4 was 4.8 mm or less and base metal (B.M) fracture when L4 was 5.6 mm or higher. Based on this, it is judged that the critical L4 length for the change in fracture location is between 4.8 and 5.6 mm.
Acknowledgement
This research was supported by the Wide-Area Industrial Promotion Program (NK200035) funded by the government (Ministry of Trade, Industry and Energy) in 2020.
References
3. N. Arivazhagan, S. Singh, S. Prakash, and G. M. Reddy, Investigation on AISI 304 austenitic stainless steel to AISI 4140 low alloy steel dissimilar joint by gas tungsten arc, electron beam and friction welding,
Mater. Des. 32 (2011) 3036ŌĆō3050.
[CROSSREF] 4. S. Wang, Q. Ma, and Y. Li, Characterization of microstructure, mechanical properties and corrosion resistance of dissimilar welded joint between 2205 duplex stainless steel and 16MnR,
Mater. Des. 32 (2011) 831ŌĆō837.
[CROSSREF] 5. I. Hajiannia, M. Shamanian, and M. Kasiri, Microstructure and mechanical properties of AISI 347 stainless steel/ A335 low alloy steel dissimilar joint produced by gas tungsten arc welding,
Mater. Des. 50 (2013) 566ŌĆō573.
[CROSSREF] 6. KS B 0802, Method of tensile test for metallic materials. Korea Standard (KS). (2003)
7. I. Hwang, D. Y. Kim, G. Jeong, M. Kang, D. Kim, and Y. M. Kim, Effect of Weld Bead Shape on the Fatigue Behavior of GMAW Lap Fillet Joint in GA 590 MPa Steel Sheets,
Met. 7 (2017) 399ŌĆō410.
https://doi.org/10.3390/met7100399
[CROSSREF] 8. D. Y. Kim, I. Hwang, G. Jeong, M. Kang, D. Kim, J. Seo, and Y. M. Kim, Effect of Porosity on the Fatigue Behavior of Gas Metal Arc Welding Lap Fillet Joint in GA 590 MPa Steel Sheets,
Met. 8 (2018) 241ŌĆō253.
https://doi.org/10.3390/met8040241
[CROSSREF] 9. J. S. Jung, H. K. Lee, and Y. W. Park, Prediction of Tensile Strength for Plasma-MIG Hybrid Welding Using Sta-tistical Regression Model and Neural Network Algorithm,
J. Weld. Join. 34(2) (2016) 67ŌĆō72.
https://doi.org/10.5781/JWJ.2016.34.2.67
[CROSSREF] 11. S. W. Lee and J. W. Kim, Selecting Optimum Conditions for SPR Processing of High Tension Plates and Aluminum Sheets Using Response Surface Methodology,
J. Weld. Join. 37(4) (2019) 339ŌĆō346.
https://doi.org/10.5781/JWJ.2019.37.4.8
[CROSSREF] 13. M. P. Groover. Fundamentals of Modern Manufacturing:Materials, Processes, and Systems. 3ed. John Willey &Sons, (Asia) Pte. Ltd; Singapore: (2007)
14. J. W. Kim, N. H. Kang, Y. D. Park, D. C. Kim, and M. J. Kang, Effect of Strength Grades of Dual Phase Steels on Failure Location and Joint Efficiency of GMAW Lap Joints,
Korean J. Met. Mater. 52(4) (2014) 319ŌĆō326.
https://doi.org/10.3365/KJMM.2014.52.4.319
[CROSSREF]


 PDF Links
 PubReader
 ePub Link
 Full text via DOI
 Download Citation
 Print
Print