1. Introduction
FCAW is mostly conducted by semi-automatic welding. In Korea, FCAW welders are most active in workshops such as shipyards. The welderŌĆÖs skill is typically evaluated by recording the results of defects, appearance of beads, etc. after welding, it can also be evaluated through mechanical tests. However, the welding quality obtained in the field is determined by the variation characteristics of the work parameters according to the welderŌĆÖs skill. Therefore, a simple and economic evaluation system is necessary to evaluate the skill of welding trainees by measuring the work parameters
1-3). Moreover, when grading the skill of trainees, it must be evaluated by more rationally measuring the operations of actual welders. By scoring the work parametersŌĆÖ variation characteristics and providing feedback to the trainees, they can develop greater interest and focus on honing their skills. Accordingly, this study seeks to establish a method for measuring the work parameters of FCAW welders, quantify the variation characteristics of the work parameters, and propose a method for grading their welding skill.
2. Experimental method
2.1 Measured Four Work Parameters
The four main work parameters measured in this study are torch height, welding speed, work angle, and travel angle
4-6). Torch height refers to the contact tip-to-workpiece distance (CTWD). Variations in these work parameters depend on the welderŌĆÖs skill and act as a factor that directly impacts welding quality. These variations in work parameters, the welderŌĆÖs empirical skill, were quantified and applied to the welderŌĆÖs skill evaluation and quality control.
2.2 Specimen and experimental method
The base metal used in this study was a 150 X 100 X 6 mm SM400. Four welders performed BOP welding in the flat position on the FCAW used in welder training. Welders A and B conducted straight welding, while welders C and D conducted weaving welding.
Table 1 shows the welding conditions used in the experiment.
Table┬Ā1
Welding condition of flat position FCAW
|
Filler metal |
AWS A5.20 E71T-1C 1.2mm |
|
Base metal |
SM400 150 X 100 X 6 mm |
|
Current |
170~230 A |
|
Voltage |
21.6~25.4 V |
2.3 Work parameter photography and measurement
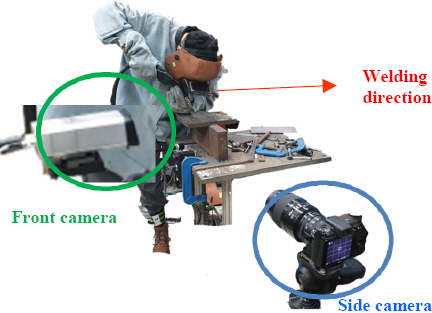
Fig. 1 shows the arrangement of the welding cameras used in this experiment. A camera was arranged to photograph the side of the welding process and captured the welding speed, torch height, and travel angle (╬Ė
T). Another camera was arranged to photograph the front of the welding process and captured the work angle (╬Ė
W) and torch height.
Fig.┬Ā1
Arrangement of welding cameras
Accounting for the distance between the camera and measurement target, just before welding, the side camera photographed a scale bar on a welding plate.
Fig. 2 shows the photographed scale bar. To measure the torch height, travel angle (╬Ė
T), and welding speed, still images were acquired at 1-second intervals from the arc starting point of images captured by the side camera. Accordingly, the still images and scale bar were used to measure the torch height, travel angle (╬Ė
T), and welding speed at 1-second intervals.
Fig. 3 shows the measurement of travel angle (╬Ė
T), welding speed, and torch height by the side camera.
Fig. 4 shows the measurement of work angle (╬Ė
W) by the front camera. To correct the torch height error, it was calculated considering the work angle (╬Ė
W).
Fig.┬Ā2
Scale bar on welding plate
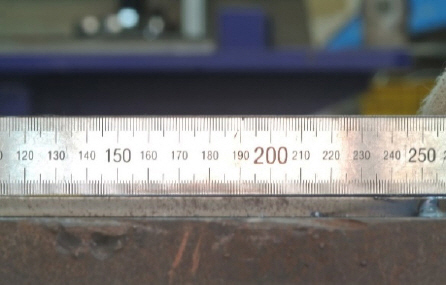
Fig.┬Ā3
Measurement by side camera video

Fig.┬Ā4
Measurement by front camera video

3. Experimental results and discussion
3.1 Measurements of work parameters
Fig. 5 shows the torch height variations when welders A and B performed straight welding.
Fig. 6 shows the torch height variations when welders C and D performed weaving welding.
Fig.┬Ā5
Torch height variation graph of welder A and B
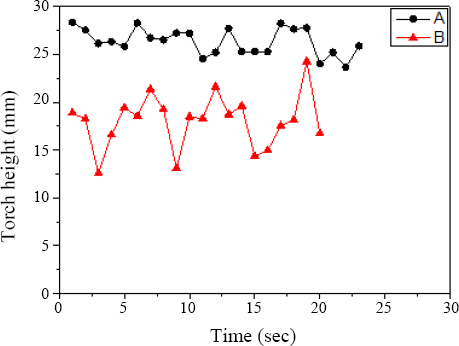
Fig.┬Ā6
Torch height variation graph of welder C and D
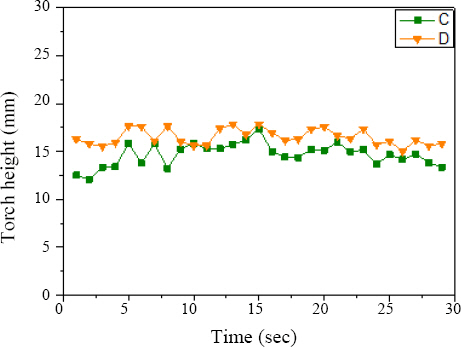
Fig. 7 shows the welding speed variations when welders A and B performed straight welding.
Fig. 8 shows the welding speed variations when welders C and D performed weaving welding.
Fig.┬Ā7
Welding speed variation graph of welder A and B
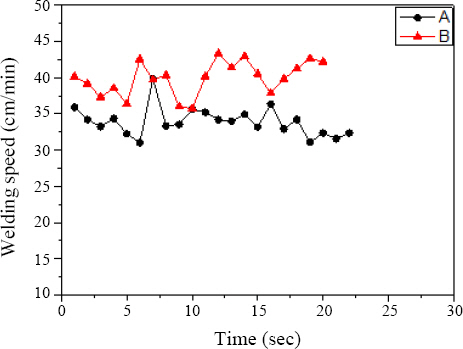
Fig.┬Ā8
Welding speed variation graph of welder C and D

Fig. 9 shows the work angle variations when welders A and B performed straight welding.
Fig. 10 shows the work angle variations when welders C and D performed weaving welding.
Fig.┬Ā9
Work angle variation graph of welder A and B

Fig.┬Ā10
Work angle variation graph of welder C and D
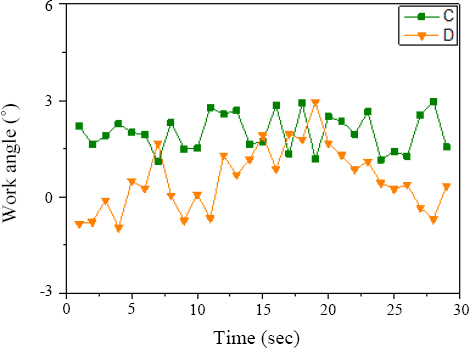
Fig. 11 shows the travel angle variations when welders A and B performed straight welding.
Fig. 12 shows the travel angle variations when welders C and D performed weaving welding.
Fig.┬Ā11
Travel angle variation graph of welder A and B
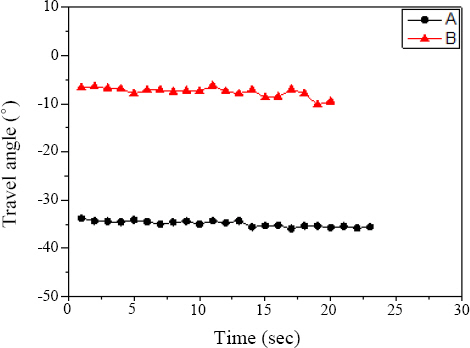
Fig.┬Ā12
Travel angle variation graph of welder C and D
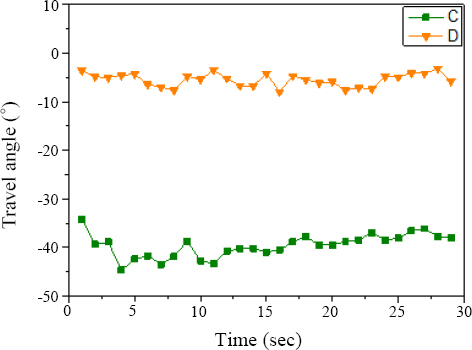
Table 2 presents the mean and standard deviation of the work parameters of welders A to D. To assess whether they were within the normal range of work parameters, the mean values of the work parameters were calculated. Moreover, since variations in the welderŌĆÖs work parameters impact the welding quality, the standard deviation was calculated to evaluate the variation in work parameters
4).
Table┬Ā2
Average and standard of working parameter of welder A~D
|
Welder |
Statistical method |
Torch height |
Welding speed |
Work angle |
Travel angle |
|
A |
Average |
26.35 |
33.9 |
3.68 |
34.92 |
|
Standard Dev. |
1.36 |
1.95 |
0.81 |
0.59 |
|
B |
Average |
18.03 |
39.9 |
0.78 |
7.59 |
|
Standard Dev. |
2.75 |
2.28 |
0.99 |
0.98 |
|
C |
Average |
26.35 |
33.9 |
3.68 |
34.92 |
|
Standard Dev. |
1.36 |
1.95 |
0.81 |
0.59 |
|
D |
Average |
18.03 |
39.9 |
0.78 |
7.59 |
|
Standard Dev. |
2.75 |
2.28 |
0.99 |
0.98 |
3.2 Evaluation method of work parameters
To evaluate the skill of welders A-D, scores were assigned considering the mean and standard deviation of the work parameters. Weights were assigned as follows considering the importance of the work parameters impacting welding quality. The weight of torch height was assigned 3, welding speed 2, work angle 1, and travel speed 1. For torch height, the score was deducted when the mean deviated from the standard of 15 mm. For welding speed, the score was deducted as the mean decreased, and for weaving welding, a lower level range than straight welding was applied. For work angle and travel angle, the score was deducted when the mean deviated from the standard of 0┬░. The greater the standard deviation of the work parameter, the more the score was deducted. The mean and standard deviation were reflected in the evaluation scores with equal weight.
Table 3 shows the score distribution for the mean and standard deviation.
Table 4 is a classification table according to the total evaluation scores.
Table┬Ā3
Score table based on average and standard deviation of working parameters
|
Torch height |
Welding speed |
Work angle |
Travel angle |
Score |
|
Straight |
Weaving |
|
Average |
Within 15┬▒2 |
Over 50 |
Over 30 |
0┬▒2┬░ |
0┬▒6┬░ |
5 |
|
Within 15┬▒4 |
Over 40 |
Over 25 |
0┬▒4┬░ |
0┬▒12┬░ |
4 |
|
Within 15┬▒6 |
Over 30 |
Over 20 |
0┬▒6┬░ |
0┬▒18┬░ |
3 |
|
Within 15┬▒8 |
Over 20 |
Over 15 |
0┬▒8┬░ |
0┬▒24┬░ |
2 |
|
Within 15┬▒10 |
Over 10 |
Over 10 |
0┬▒10┬░ |
0┬▒30┬░ |
1 |
|
Standard Dev. |
0~1 |
0~1 |
0~1 |
0~1 |
5 |
|
1~2 |
1~2 |
1~2 |
1~2 |
4 |
|
2~3 |
2~3 |
2~3 |
2~3 |
3 |
|
3~4 |
3~4 |
3~4 |
3~4 |
2 |
|
4~5 |
4~5 |
4~5 |
4~5 |
1 |
|
Weight |
3 |
2 |
1 |
1 |
|
Table┬Ā4
Classification table by total score
|
Total score |
|
0~ 10 |
11~20 |
21~30 |
31~40 |
41~50 |
51~60 |
61~70 |
|
Grade |
1 |
2 |
3 |
4 |
5 |
6 |
7 |
3.3 Work parameter evaluation results of welders A-D
Table 5 shows the evaluation scores for the work parameters of welders A-D. Welder 7 showed the highest score at 67, and was thus assigned Grade 7. Welders B and C scored 52 and 55 points, respectively and both were assigned Grade 6. Welder A was assigned Grade 4 with 40 points. The welders who participated in this evaluation were highly skilled in the field and thus obtained high grades. However, when beginner trainees receive a low grade, their individual welding operations are quantitatively analyzed and the welderŌĆÖs skill is evaluated, thereby serving as individual feedback. Therefore, this system enables high-efficiency training and the traineeŌĆÖs psychology growth, inducing them to easily concentrate.
Table┬Ā5
Score and grade of welder A ~ D
|
Welder |
Average score |
Standard Dev. Score |
Total score |
Grade |
|
A |
10 |
30 |
40 |
4 |
|
B |
27 |
25 |
52 |
6 |
|
C |
27 |
28 |
55 |
6 |
|
D |
33 |
34 |
67 |
7 |
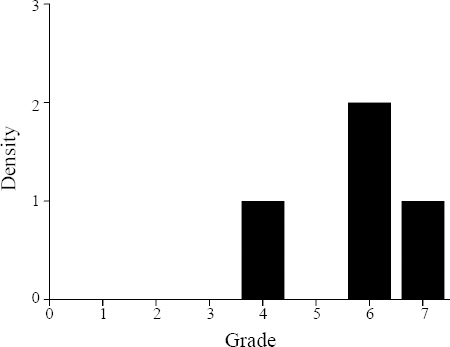
Fig. 13 is a graph of the four weldersŌĆÖ grades expressed in the form of probability density functions. As the welders were all highly skilled, they are distributed among the higher grades. Meanwhile, beginners will be distributed among the lower grades, and the distribution characteristics will differ widely according to the learning group. Since these distribution characteristics can be used to easily evaluate the level of a group or corporate organization, they can also be easily applied to welding contracts.
Fig.┬Ā13
Distribution of welderŌĆÖs grade in the form of probability density function
4. Conclusions
To evaluate the functional levels of FCAW welders using work processes rather than welding results, the variation characteristics of four main work parameters (welding speed, torch height, work angle, and travel angle) were recorded in videos, measured, and analyzed, and the following conclusions were drawn.
1) This study proposed a method of measuring four main work parameters at 1-second intervals by taking videos of welders directly using an arc front camera, side camera, and scale.
2) When the weldersŌĆÖ skill were evaluated considering the welding parameterŌĆÖs importance in quality: the weight of torch height was assigned 3, welding speed 2, work angle 1, and travel angle 1.
3) A system was presented in which the mean and standard deviation of the four work parameters are evaluated, scored with equal weight, and then provided to the trainees as feedback, though which they can hone their own skills.
4) A method was proposed for statistically evaluating the skill of a group or corporate organization by grading the weldersŌĆÖ skill from 1 to 7, based on evaluation of the variation characteristics of the work parameters.
Acknowledgments
This study was supported by the KEIT research fund of the Ministry of Trade, Industry and Energy. [No: 20003633]
References
1. C. S. Wu, Microcomputer-based welder training simulator,
Comput Ind. 20(3) (1992) 321ŌĆō325. https://doi.org/10.1016/016613615(92)90080-7
[CROSSREF] 2. K. Fast, T. Gifford, and R. Yancey, Virtual training for welding,
Third IEEE and ACM International Symposium on Mixed and Augmented Reality (ISMAR 2004), Arlington, USA. (2004)
[CROSSREF] 3. S. H. Hwang, A study on Korean welding education and qualification system(I), J. Korean Weld. Join. Soc. 20(2) (2002) 4ŌĆō12.
4. R. Stone, K. Watts, P. Zhong, and C. S. Wei, Physical and cognitive effects of virtual reality integrated training,
Hum Factors. 53(5) (2011) 558ŌĆō572. https://doi.org/10.1177/001ŌłÉ811413389
[CROSSREF] [PUBMED] 5. W. Steven, R. Dirk, P. Mores, B. Christoph, and C. Terrence, Virtual reality welder training,
J. Ship Prod. Des. 22(3) (2006) 126ŌĆō138. https://doi.org/10.1117/12.840473
[CROSSREF] [PDF] 6. E. Choi, J. Y. Kim, S. H. Shin, and S. Y. Kim, A study on the analysis effectiveness of the virtual welding simulator for welding manpower development,
J. Weld. Join. 33(3) (2015) 40ŌĆō46. https://doi.org/10.5781/jwj.2015.33.3.40
[CROSSREF] [PDF]


 PDF Links
 PubReader
 ePub Link
 Full text via DOI
 Download Citation
 Print
Print