


1. ņä£ ļĪĀ
ņĀĆņ×ÉļōżņØĆ 2005ļģäļČĆĒä░ ĒåĄĻ│äļź╝ ņØ┤ņÜ®ĒĢ£ ņÜ®ņĀæņé░ņŚģ ĒśäĒÖ®ļŹ░ņØ┤Ēä░ļź╝ ļīĆĒĢ£ņÜ®ņĀæņĀæĒĢ®ĒĢÖĒÜīņ¦ĆņŚÉ Ēł¼Ļ│ĀĒĢśĻ│Ā ņ׳ņ£╝ļ®░1-3), ļÅÖņØ╝ĒĢ£ ļ░®ļ▓ĢļĪĀņØä ņØ┤ņÜ®ĒĢśņŚ¼ ĒśäĒÖ®ļČäņäØ ņ×ÉļŻīļź╝ ņŚģļŹ░ņØ┤ĒŖĖĒĢśĻ│Āņ×É ĒĢ£ļŗż. ņÜ®ņĀæ┬ĘņĀæĒĢ®ĒÄĖļ×īņŚÉ ļö░ļź┤ļ®┤ ņÜ®ņĀæĻ│ĄņĀĢņØĆ ņ×¼ļŻīļź╝ Ļ░ĆĻ│ĄĒĢśņŚ¼ ļČĆĒÆłņØä ņĀ£ņ×æĒĢśļŖö ļŗ©Ļ│äņÖĆ ļČĆĒÆłņØä ņĪ░ļ”ĮĒĢśņŚ¼ ņĀ£ĒÆłņØä ņĀ£ņ×æĒĢśļŖö ļŗ©Ļ│äņŚÉ ņĀüņÜ®ļÉ£ļŗż4). ĻĖ░ņĪ┤ņØś ļ░®ļ▓ĢļĪĀņŚÉņä£ ņÜ®ņĀæņ×¼ļŻī, ņÜ®ņĀæĻĖ░ņÖĆ Ļ░ÖņØ┤ ĒåĄĻ│äļź╝ ĒåĄĒĢ┤ ņēĮĻ▓ī ĒśäĒÖ®ņØä ļÅäņČ£ĒĢĀ ņłś ņ׳ļŖö ĒÆłļ¬®ņØ┤ ņĢäļŗī ņłśņÜöņé░ņŚģņŚÉņä£ņØś ņÜ®ņĀæņé░ņŚģņØś ļČĆļČä ĒśäĒÖ®ņØĆ 2002ļģä ļ»ĖĻĄŁņÜ®ņĀæĒĢÖĒÜī(AWS)ņŚÉņä£ ļ░£Ļ░äĒĢ£ ņ×ÉļŻī5)ļź╝ ļ░öĒāĢņ£╝ļĪ£ ĒĢśņśĆļŗż.
2. ĒåĄĻ│ä ļÅäņČ£ ļ░®ļ▓Ģ
ņÜ®ņĀæņé░ņŚģņØś ļ¦żņČ£ņĢĪ ņĪ░ņé¼ļź╝ ņ£äĒĢśņŚ¼ ĒåĄĻ│äņ▓ŁņŚÉņä£ Ļ│Ąņŗ£ĒĢ£ 2011ļģäņŚÉņä£ 2017ļģäĻ╣īņ¦ĆņØś ņé░ņŚģ ļČäļźśļ│ä ļ¦żņČ£ĒśäĒÖ®6)ņØä ņØ┤ņÜ®ĒĢśņśĆņ£╝ļ®░, 10ņ░© ņé░ņŚģļČäļźśņØś Ļ▓ĮņÜ░ ĒåĄĻ│äņŚÉ ņé¼ņÜ®ļÉ£ ņé░ņŚģņØś Ļ▓ĮņÜ░ Table 1Ļ│╝ Ļ░ÖņØ┤ ņé░ņŚģņĮöļō£Ļ░Ć ļ│ĆļÅÖļÉśņ¦Ć ņĢŖņĢśļŗż3). ņÜ®ņĀæņŗ£Ļ│Ąņé░ņŚģņŚÉņä£ ņÜ®ņĀæņé░ņŚģņØś ļČĆļČäĻ░ÆņØĆ Table 2ņÖĆ Ļ░ÖņØ┤ ļ»ĖĻĄŁņÜ®ņĀæĒĢÖĒÜīņŚÉņä£ ņĪ░ņé¼ĒĢ£ ļ╣äņ£©ņØä ņØ┤ņÜ®ĒĢśņśĆļŗż5). ņłśņČ£ņ×ģĻ│╝ Ļ┤ĆļĀ©ĒĢ£ ļ¼┤ņŚŁĒśæĒÜīņ×ÉļŻīņØś HSKņĮöļō£ņØś ļČäļźśļÅä ļ│ĆļÅÖņØ┤ ņŚåņ¢┤ ĻĖ░ņĪ┤ņØś ņ×ÉļŻīņŚÉņä£ ņé¼ņÜ®ĒĢ£ ļ░®ļ▓ĢĻ│╝ ļÅÖņØ╝ĒĢśļ®░ ņé¼ņÜ®ĒĢ£ HSKņĮöļō£ļź╝ Table 3ņŚÉ ļéśĒāĆļé┤ņŚłļŗż3,7).
Table┬Ā1
Industry classification for sales statistics
Table┬Ā2
Proportion of welding-related expenditure for each welding application industry5)
Table┬Ā3
HSK classification used in export/import statistics
3. ĒåĄĻ│äņĪ░ņé¼Ļ▓░Ļ│╝
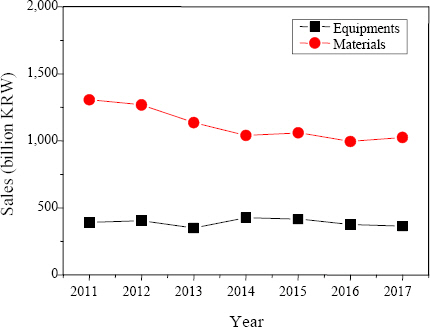
3.1 ļ¦żņČ£ņĢĪ
ņÜ®ņĀæņé░ņŚģņØś ļ¦żņČ£ņĢĪņØĆ ņÜ®ņĀæņ×¼ļŻīņé░ņŚģĻ│╝ ņÜ®ņĀæĻĖ░ņé░ņŚģņØś ļ¦żņČ£ņĢĪĻ│╝ ņÜ®ņĀæņŗ£Ļ│Ąņé░ņŚģ ļ¦żņČ£ņĢĪ ņżæ ņÜ®ņĀæ ĻĖ░ņŚ¼ļČäņØä ļŹöĒĢśņŚ¼ Ļ│äņé░ĒĢĀ ņłś ņ׳ļŗż. Fig. 1ņØĆ 2004ļģäņŚÉņä£ 2017ļģä ņÜ®ņĀæņé░ņŚģņØś ļ¦żņČ£ņĢĪņØä ļ│┤ņŚ¼ņżĆļŗż. ņ¦ĆņåŹņĀüņ£╝ļĪ£ ņä▒ņןĒĢśļŹś ņÜ®ņĀæņé░ņŚģņØś ļ¦żņČ£ņĢĪņØ┤ 2011ļģä ņØ┤Ēøä Ļ│äņåŹ Ļ░ÉņåīĒĢśļŖö Ļ▓ĮĒ¢źņØä ļ│┤ņØ┤ļŗżĻ░Ć 2016ļģäĻ│╝ 2017ļģäņŚÉļŖö Ēü░ ĒÅŁņ£╝ļĪ£ Ļ░ÉņåīĒĢśņŚ¼ 10ļģä ņĀä 2007ļģäĻ│╝ Ļ░ÖņØ┤ 5ņĪ░ņøÉļīĆļĪ£ ļ¦żņČ£ņĢĪņØ┤ Ļ░ÉņåīĒĢśņśĆļŗż3).

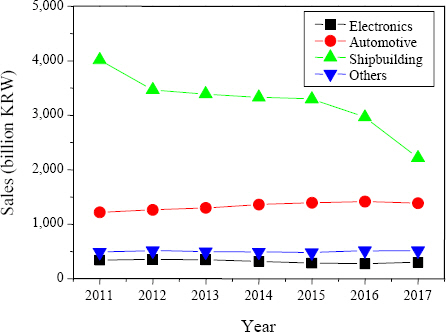
ņÜ®ņĀæĻĖ░ņ×Éņ×¼ņé░ņŚģņØś Ļ▓ĮņÜ░ ņØ╝ņĀĢ ņłśņżĆņØś ļ¦żņČ£ņØ┤ ņ£Āņ¦ĆļÉśņŚłņ£╝ļéś ņÜ®ņĀæņ×¼ļŻīņé░ņŚģņŚÉņä£ 3,000ņ¢ĄņøÉ Ļ░ĆĻ╣īņÜ┤ ļ¦żņČ£ņĢĪ Ļ░ÉņåīĻ░Ć ļ░£ņāØĒĢśņśĆļŗż(Fig. 2). ļśÉĒĢ£ ņÜ®ņĀæņŗ£Ļ│Ąņé░ņŚģņŚÉņä£ļŖö ņĪ░ņäĀņé░ņŚģņØś ņ£äĻĖ░ļĪ£ ņØĖĒĢśņŚ¼ 2ņĪ░ņøÉ Ļ░ĆĻ╣īņÜ┤ ļ¦żņČ£ Ļ░ÉņåīĒÜ©Ļ│╝ļź╝ ņØ╝ņ£╝ņ╝£(Fig. 3), ņÜ®ņĀæņ×¼ļŻīņé░ņŚģĻ│╝ ņĪ░ņäĀņé░ņŚģņØś ļ¦żņČ£ Ļ░ÉņåīĻ░Ć ņÜ®ņĀæņé░ņŚģ ļ¦żņČ£Ļ░ÉņåīņØś ņøÉņØĖņ£╝ļĪ£ ņ×æņÜ®ĒĢśņśĆļŗż.
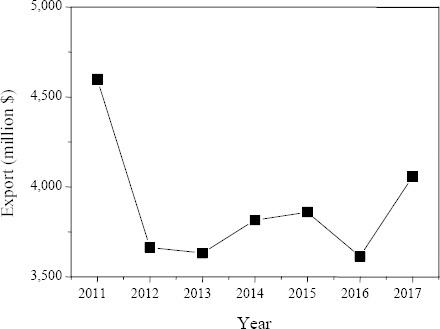
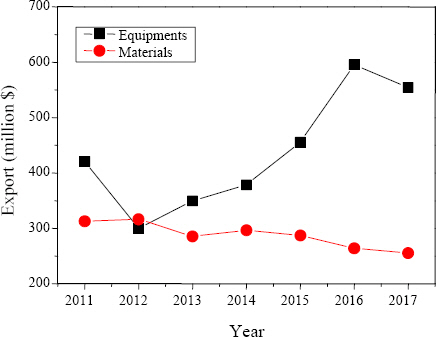
3.2 ņłśņČ£ņ×ģņĢĪ
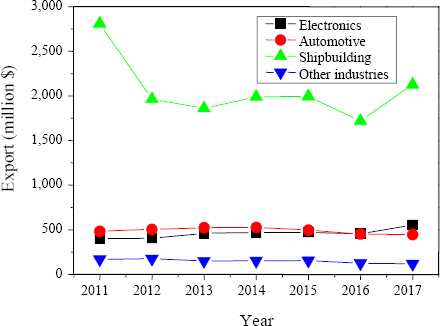
2011ļģäņŚÉņä£ 2017ļģä ņÜ®ņĀæņé░ņŚģ ņłśņČ£ņĢĪņØä ņĪ░ņé¼ĒĢ£ Ļ▓░Ļ│╝ 2012ļģä Ēü¼Ļ▓ī Ļ░ÉņåīĒĢ£ ņłśņČ£ņĢĪņØ┤ Ļ│äņåŹ ņ£Āņ¦ĆļÉśļŗżĻ░Ć 2017ļģä ļŗżņŗ£ ņØ╝ļČĆ ņ”ØĻ░ĆĒĢśņŚ¼ 40ņ¢ĄļČł ņłśņżĆņØ┤ļŗż(Fig. 4). ĻĘĖļ¤¼ļéś 2011ļģä ļīĆļ╣äĒĢśņŚ¼ 2017ļģä ņłśņČ£ņĢĪņØ┤ 5ņ¢ĄļČł Ļ░Ćļ¤ē ņĀüņØĆ ņłśņżĆņØ┤ļŗż. Fig. 5ņÖĆ Ļ░ÖņØ┤ ņĀäņ▓┤ ņÜ®ņĀæņé░ņŚģ ņłśņČ£ņĢĪ ļÅÖĒ¢źņØĆ ņĪ░ņäĀņé░ņŚģņØś ņÜ®ņĀæ ņłśņČ£ņĢĪņØś ļÅÖĒ¢źĻ│╝ Ļ▒░ņØś ņØ╝ņ╣śĒĢ£ļŗż. ņØ┤ļŖö ņĪ░ņäĀņé░ņŚģņŚÉņä£ ņÜ®ņĀæ ļ╣äņżæņØ┤ ļåÆĻ│Ā ĒāĆ ņé░ņŚģņŚÉņä£ ņłśņČ£ņØĆ ņāüļīĆņĀüņ£╝ļĪ£ Ļ▒░ņØś ļ│ĆĒÖöĻ░Ć ņŚåņŚłĻĖ░ ļĢīļ¼ĖņØ┤ļŗż. Fig. 6Ļ│╝ Ļ░ÖņØ┤ ņÜ®ņĀæĻĖ░ņ×Éņ×¼ ņé░ņŚģņØś Ļ▓ĮņÜ░ ņāüļīĆņĀüņ£╝ļĪ£ ņłśņČ£ņØ┤ ĒĢ┤ļŗ╣ ĻĖ░Ļ░ä ņ”ØĻ░ĆĒĢśļŖö Ļ▓ĮĒ¢źņØ┤ ĒÖĢņØĖļÉśņŚłņ£╝ļéś, ņ×ÉņäĖĒĢ£ ņøÉņØĖņŚÉ ļīĆĒĢ┤ņä£ļŖö ļ│Ė ņŚ░ĻĄ¼ ļŹ░ņØ┤Ēä░ņÖĖņØś ļ│äļÅäņØś Ļ▓ĆĒåĀĻ░Ć ĒĢäņÜöĒĢśļŗż. ņÜ®ņĀæĻĖ░ņ×Éņ×¼ņØś Ļ▓ĮņÜ░ ņłśņČ£ņØ┤ ņłśņ×ģņŚÉ ļ╣äĒĢ┤ 2ļ░░ ņĀĢļÅä ļåÆņØĆ ņłśņżĆņØ┤ļ®░, ņłśņ×ģņĢĪņØĆ 2017ļģä ĻĖ░ņżĆ 2.5ņ¢ĄļČł ĻĘ£ļ¬©ņØ┤ļŗż. ņÜ®ņĀæņ×¼ļŻīņØś Ļ▓ĮņÜ░ ņłśņČ£Ļ│╝ ņłśņ×ģņØ┤ ļ¬©ļæÉ ĒĢ┤ļŗ╣ĻĖ░Ļ░ä Ļ░ÉņåīĒĢśļŖö Ļ▓ĮĒ¢źņØä ļ│┤ņśĆņ£╝ļ®░(Fig. 6,7), ņØ┤ļŖö ņŻ╝ņÜö ņÜ®ņĀæ ņŗ£Ļ│Ąņé░ņŚģņØĖ ņĪ░ņäĀ, ņżæĻ│ĄņŚģņé░ņŚģņØś ļČłĒÖ®ņŚÉ ĻĖ░ņØĖĒĢśļŖö Ļ▓āņ£╝ļĪ£ ņČöļĪĀļÉ£ļŗż.

4. ņŗ£ ņé¼ ņĀÉ
ņÜ®ņĀæņé░ņŚģņØś Ļ▓ĮņÜ░ ņŗ£Ļ│Ąņé░ņŚģņØś ļé┤ļČĆņŚÉņä£ ņØ┤ļŻ©ņ¢┤ņ¦ĆļŖö ņÜ®ņĀæĻ│ĄņĀĢņØś ĒŖ╣ņä▒ņ£╝ļĪ£ ņØĖĒĢ┤ ļ¦żņČ£ ļ░Å ņłśņČ£ņ×ģ ļČäņäØņØ┤ ņÜ®ņØ┤ĒĢśņ¦Ć ņĢŖņĢśļŗż. ļ│Ė ņŚ░ĻĄ¼ņŚÉņä£ļŖö ņé░ņŚģļ│ä ĻĖ░ņŚ¼ņ£©ņØä ņØ┤ņÜ®ĒĢ£ ĒåĄĻ│ä ņ×ÉļŻīļź╝ ņŚģļŹ░ņØ┤ĒŖĖĒĢśņśĆļŗż. ņØ┤ņÖĆ ļ│äļÅäļĪ£ ņĄ£ĻĘ╝ņŚÉļŖö ņĀäĒÖöņØĖĒä░ļĘ░ļź╝ ņØ┤ņÜ®ĒĢ£ ĒåĄĻ│äņ×ÉļŻīĻ░Ć ĻĄŁĻ░Ćļ┐īļ”¼ņé░ņŚģņ¦äĒØźņä╝Ēä░(ļ┐īļ”¼ņä╝Ēä░)ļź╝ ĒåĄĒĢ┤ ņĪ░ņé¼ļÉśĻ│Ā ņ׳ļŗż. Ēśäņ×¼ ĻĖ░ļ▓ĢņØä ņØ┤ņÜ®ĒĢĀ Ļ▓ĮņÜ░ ņÜ®ņĀæņé░ņŚģņØś ļ¦żņČ£ņĢĪņØĆ 6ņĪ░ņøÉņŚÉ ņĢĮĻ░ä ļ¬╗ ļ»Ėņ╣śļŖö ņłśņżĆņØ┤ļéś, ņĀäĒÖöņØĖĒä░ļĘ░ ĒåĄĻ│äņĪ░ņé¼ņŚÉņä£ļŖö 2016ļģä ĻĖ░ņżĆņ£╝ļĪ£ 43ņĪ░ ļ¦żņČ£ņĢĪņØ┤ ņĪ░ņé¼ļÉśņŚłļŗż. ņØ┤ļŖö ņĀäņ▓┤ ļ¦żņČ£ņĢĪ ļīĆļ╣ä ņÜ®ņĀæņŗ£Ļ│ĄņØś ĻĖ░ņŚ¼ņ£©ņŚÉ ļīĆĒĢ£ ĒÖśņé░ĻĖ░ļ▓ĢņØś ņ░©ņØ┤ņŚÉ ĻĖ░ņØĖĒĢ£ļŗż. ļŗ╣ņ┤ł AWSņØś Ļ▓ĮņÜ░ Ļ░ü ņé░ņŚģļ│äļĪ£ ņĀäņ▓┤ ņ¦ĆņČ£ņŚÉņä£ ņÜ®ņĀæĻ┤ĆļĀ© ņ¦ĆņČ£ņØś ļ╣äņżæņØä ņĪ░ņé¼ĒĢśņśĆņ£╝ļéś, ļ┐īļ”¼ņä╝Ēä░ņŚÉņä£ļŖö ņĀäņ▓┤ ļ¦żņČ£ņŚÉņä£ ņÜ®ņĀæņŗ£Ļ│ĄņØś ĻĖ░ņŚ¼ņ£©ņØä ņĪ░ņé¼ĒĢśņśĆĻĖ░ ļĢīļ¼ĖņØ┤ļŗż. AWSņĪ░ņé¼ņŚÉņä£ ņĪ░ņäĀņé░ņŚģ ļé┤ņŚÉņä£ ņÜ®ņĀæĻ┤ĆļĀ© ņ¦ĆņČ£ņØś ļ╣äņ£©ņØĆ 5.19%ņØ┤ļéś ņŗżņĀ£ ņĪ░ņäĀņåīņŚÉņä£ ņĀ£ņ×æ Ļ│ĄņłśņØś ņĀłļ░ś ņØ┤ņāüņØä ņÜ®ņĀæĻ│ĄņĀĢņØ┤ ņ░©ņ¦ĆĒĢśļ»ĆļĪ£ ļ¦żņČ£ņĢĪ ņżæ ļ╣äņżæ ĒÖśņé░ ĻĖ░ņżĆņŚÉ ļö░ļØ╝ ņÜ®ņĀæņé░ņŚģņØś ļ¦żņČ£ ĻĘ£ļ¬©Ļ░Ć Ēü¼Ļ▓ī ļŗ¼ļØ╝ņ¦ł ņłś ņ׳ļŗż. Ē¢źĒøä ĻĄŁļé┤ ņé░ņŚģņŚÉņä£ ņÜ®ņĀæņŗ£Ļ│Ą ĻĖ░ņŚ¼ņ£©ņØ┤ Ļ░ü ņłśņÜöņé░ņŚģļ│äļĪ£ ņĪ░ņé¼ļÉ£ļŗżļ®┤ ņĀäĒÖöņØĖĒä░ļĘ░Ļ░Ć ņĢäļŗī ĒåĄĻ│äņ×ÉļŻīļź╝ ĒÖ£ņÜ®ĒĢ£ ņé░ņŚģ ļ¦żņČ£ ņĪ░ņé¼ĻĖ░ļ▓ĢļÅä ņĀüņÜ® Ļ░ĆļŖźĒĢĀ Ļ▓āņ£╝ļĪ£ ĒīÉļŗ©ļÉ£ļŗż.
ņÜ®ņĀæņé░ņŚģņØś Ļ▓ĮņÜ░ Ļ░Ćņן ņżæņÜöĒĢ£ ņłśņÜöņé░ņŚģņØĖ ņĪ░ņäĀņé░ņŚģņØś ļČłĒÖ®Ļ│╝ ņØ┤ņŚÉ ļö░ļźĖ ņÜ®ņĀæņ×¼ļŻīņé░ņŚģņØś ļ¦żņČ£ņĢĪ ļČĆņ¦äņ£╝ļĪ£ ņØĖĒĢśņŚ¼ ļ¦żņČ£ņĢĪņØ┤ 10ļģä ņĀä ņłśņżĆņ£╝ļĪ£ ĒøäĒć┤ĒĢśņśĆļŗż. ņĄ£ĻĘ╝ ņĪ░ņäĀņŚģņØ┤ ņĪ░ĻĖłņö® ņé┤ņĢäļé©ņŚÉ ļö░ļØ╝ ļ¦żņČ£ ņ”ØĻ░ĆĻ░Ć Ē¢źĒøä ņśłņāüļÉśĻ│Ā ņ׳ņ£╝ļéś, ņÜ®ņĀæņé░ņŚģņØś ņāłļĪ£ņÜ┤ ņłśņÜöņ▓śļź╝ ļ░£ĻĄ┤ĒĢśņŚ¼ ņØśņĪ┤ļÅäļź╝ ļé«ņČ£ ĒĢäņÜöņä▒ņØ┤ ņ׳ļŗż. ņĪ░ņäĀņé░ņŚģ ļ¦īĒü╝ņØś ņÜ®ņĀæļ¤ēņØä ĒāĆ ņé░ņŚģņŚÉņä£ ĒÖĢļ│┤ĒĢśļŖö Ļ▓āņØĆ Ļ│Ąļ▓Ģņāü ĒĢ£Ļ│äĻ░Ć ņ׳ņ¦Ćļ¦ī ļČĆĻ░Ć
Ļ░Ćņ╣śņĀüņØĖ Ļ┤ĆņĀÉņŚÉņä£ ļŗżņ¢æĒĢ£ ņłśņÜöņé░ņŚģņŚÉņä£ņØś Ļ│ĀļČĆĻ░Ć ņÜ®ņĀæ ņĀüņÜ®ņØä ĒÖĢļīĆĒĢĀ ĒĢäņÜöĻ░Ć ņ׳ļŗż. ņÜ®ņĀæņ×¼ļŻī ņé░ņŚģņØś Ļ▓ĮņÜ░ ļ¦żņČ£ ļ░Å ņłśņČ£ņØ┤ ņ¦ĆņåŹņĀüņ£╝ļĪ£ Ļ░ÉņåīļÉśĻ│Ā ņ׳ļŗż. ĒØźļ»ĖļĪ£ņÜ┤ ņé¼ņŗżņØĆ ņÜ®ņĀæĻĖ░ņ×Éņ×¼ ņé░ņŚģņØś ņłśņČ£ņØ┤ ņĄ£ĻĘ╝ ņ”ØĻ░ĆņČöņäĖņŚÉ ņ׳ņŚłņ£╝ļ®░, ņłśņ×ģņĢĪļÅä 2.5ņ¢ĄļČł ņłśņżĆņØ┤ņŚłļŗż. ņØ┤ņŚÉ ļīĆĒĢ£ ņ×ÉņäĖĒĢ£ ļČäņäØņØä ĒåĄĒĢ£ ĻĖ░ņ×Éņ×¼ņé░ņŚģņØś ļ░£ņĀä ņĀäļץ ļ░Å ņłśņ×ģļīĆņ▓┤ ĒÖ£ļÅÖņØ┤ ĒĢäņÜöĒĢśļŗż.
 PDF Links
 PubReader
 ePub Link
 Full text via DOI
 Download Citation
 Print
Print