Comparative Analysis of SPR and SPR-Bonded Joints of Hot Press Forming Steel and AA5052 under Corrosive Conditions
Article information

Abstract
The increasing demand for effective joining techniques in dissimilar materials has led to the widespread use of self-piercing rivet (SPR) mechanical joints, particularly in aluminum combinations. Studies in this field aim to enhance joint strength by optimizing process conditions, including the use of SPR-bonded processes with structural adhesives. Structural adhesives in SPR-bonded processes introduce different corrosion behavior owing to galvanic corrosion caused by potential differences between sheets over time. In this study, we utilize SORPAS® simulation to optimize SPR conditions and analyze stress and deformation. A tensile shear test was performed on a hot pressforming steel/AA5052-H32 combination for SPR and SPR-bonded processes. The experimental results indicated die sticking during SPR optimization, increased tensile strength through AA5052-H32 surface cleaning in the SPR-bonded process, varying corrosion conditions, and consistent SPR-bonded strength after salt spray exposure. The difference in failure modes between the processes concerning corrosion time can be attributed to the corrosion-mitigating effect of structural adhesive within the galvanic coupling region formed by potential differences. Additionally, adhesive and rivet failure modes were observed. Moreover, adhesive failure occurred in the SPR-bonded process after shear tensile tests, characterized by a fracture between the lower AA5052-H32 interface and adhesive. Furthermore, we found a linear relationship between the remaining adhesive area and shear tensile strength.
1. Introduction
In the automobile industry, various methods have been presented to achieve fuel efficiency due to the reinforcement of environmental regulations caused by global warming. For chassis components, which represent more than 30% of the vehicle weight, weight reduction has been attempted by replacing existing steel materials with high-strength steel or applying lightweight materials, such as aluminum, magnesium, and carbon fiber reinforced plastic (CFRP), along with the combination of heterogeneous materials. The resistance spot welding (RSW) process, mainly used to combine chassis components, forms intermetallic compounds that degrade mechanical properties during welding with lightweight materials, such as aluminum, or makes it difficult to control welding conditions due to high thermal conductivity. Accordingly, the demand for various bonding technologies is increasing for joining heterogeneous materials, including lightweight materials. Among them, the self-piercing rivet (SPR) process has been commonly applied to fasten heterogeneous materials, including aluminum. The SPR process forms clamping force using rivets that penetrate through materials. It requires a short time, as with the RSW process and has a relatively low bonding cost. It exhibits high collision strength and fatigue performance compared to the RSW process because it causes no thermal deformation of the base metal1,2).
Previous studies on SPR are mostly focused on a comparison with the monitoring data derived in real time during the SPR process using analysis software to improve bonding strength3,4) or the optimization of process conditions by predicting bonding quality and mechanical properties through the change in stress and plastic deformation caused by material combinations and process conditions5-7). In the case of the combination of heterogeneous materials, however, galvanic corrosion caused by the potential difference between the rivet and material or between heterogeneous materials decreases bonding strength over time despite the optimization of fastening process conditions. Mandel et al.8) analyzed corrosion behavior at SPR joints between aluminum alloy and CFRP, and explained that mechanical properties may degrade when a load is applied due to the local stress caused by the formed corrosion product. Kotadia et al.9) reported that cracking may occur at SPR joints between aluminum alloy and steel when a load is applied due to the presence of intermetallic compounds on the aluminum alloy surface after corrosion. Calabrese et al.10) reported that the presence of internal stress caused by the cold forming process in the SPR process may lower the strength of SPR joints by accelerating the activation of the local cracks caused by stress-corrosion cracking in a corrosion environment.
In the automotive body structure, when collision occurs, it is challenging to achieve crash performance solely through SPR joints. Therefore, the SPR-bonded process, which involves applying structural adhesive to SPR joints, is widely used11). However, existing research has mainly focused on limited aspects, such as galvanic corrosion behavior and changes in joint strength characteristics in SPR joints with hybrid material combinations. There is a lack of research investigating the correlation between corrosion behavior in corrosive environments and mechanical property changes, including tensile strength and fracture modes, in joints where structural adhesive is mixed in SPR- bonded processes. Hence, this paper aims to evaluate the joint quality of SPR and SPR-bonded processes applied to a combination of 1.5 GPa grade Hot Press Forming Steel (HPF steel) and AA5052 hybrid materials. Additionally, it seeks to analyze the surface corrosion state changes over time in a salt spray environment and the corresponding changes in shear tensile strength and fracture modes. The objective is to understand the causes of corrosion behavior and mechanical property changes in both SPR and SPR-bonded processes.
2. Experimental Method
2.1 Specimen preparation
In this study, materials were combined and specimens were prepared as follows. For the material combination, a 1.2mm-thick 1.5GPa HPF steel material with an aluminum-Si-plated layer was used as the top sheet. A 3.0mm-thick AA5052-H32 material was used as the bottom sheet. In the case of specimen preparation, a 100mm × 30mm top sheet and a bottom sheet with a joint area of 30 mm2 were prepared in accordance with the KS B 0802 tensile test standard as shown in the schematics in Fig. 1. SPR and SPR-bonded processes were applied as bonding processes, respectively. A D-type thermosetting structural adhesive was used as the adhesive of the SPR-bonded process. After applying it to the joint interface with an area of 30 mm2 on both sides, the SPR process was performed. The paint baking process was then applied at approximately 180°C for 30 minutes to harden the adhesive.

Geometry and dimensions of tensile shear test specimen
2.2 SPR process analysis and condition setting
For a combination of the top sheet (1.5GPa HPF steel) and bottom sheet (AA5052-H32), a rivet and dies from BÖLLHOFF were used in the SPR process. Three types of dies (A, B, and C) and an ultra-high-strength HDX-type rivet for sheets with a hardness of approximately 530 to 575 Hv were selected. Fig. 2 shows the cross-sectional shape of the rivet. For the selection of optimal SPR process conditions, the plastic deformation behavior of the joint during the SPR process was examined using the SORPAS® simulation software, which is highly reliable for measuring major SPR quality factors due to the inserted clamp and verified friction effect12). Analysis modeling was constructed as shown in Fig. 3. The die, punch, and blank holder were rigid bodies. For the interaction between the components, the Coulomb friction law that introduced the friction coefficients derived from previous studies was applied13). The speed control method was used for the vertical movement of the punch. The analysis results were presented in four stages as shown in Fig. 4. Fig. 4(a) is the stage in which the punch is pressed. The top and bottom sheets sagged under the pressure of the punch, and the rivet has not penetrated the top sheet. Fig. 4(b) represents the stage where the rivet initiates penetration into the top sheet without deformation, while the bottom sheet undergoes plastic deformation according to the die’s geometry. In Fig. 4(c), the rivet penetrates the top sheet (HPF steel) and the pierced top sheet does not fill the rivet cavity due to the high strength of HPF steel, causing a flow with the rivet legs to the aluminum bottom sheet. In addition, as the bottom sheet completely fills the die, the stress by reaction force and the beginning of the rivet leg deformation are observed. In Fig. 4(d), the leg deformation and flaring of the rivet are completed, thereby forming an interlock between the top and bottom sheets. Significantly high effective deformation is observed in the bottom sheet area joining the pierced top sheet at the end of the rivet legs, indicating a lack of the residual thickness of the bottom sheet and the possibility of penetration. Based on the analysis results, seven experimental conditions were set as shown in Table 1. rivet lenghts of 6.0 mm and 7.0 mm were chosen. In the case of the process variables, the pre-clamping force was fixed at 4.0 kN and then the experiment was performed using setting forces of 70 and 78 kN. Three joint quality factors were then measured from the cross-sectional geometry as shown in Fig. 5. To measure the clamping force formed by the rivet, the length from the position at which the rivet leg penetrates the bottom sheet to the reference line, which is the vertical downward line from the position where the top sheet, bottom sheet, and rivet are in contact in the cross section, was defined as “interlock”. In addition, the penetration depth of the rivet through the bottom sheet was defined as “Teff”. The residual thickness of the bottom sheet subjected to plastic deformation by the rivet was defined as “bottom thickness”. Since the joint quality factors vary depending on process conditions, such as the rivet length, die type, and force, they were measured according to process conditions to select process conditions that are suitable for the material combination of this study.
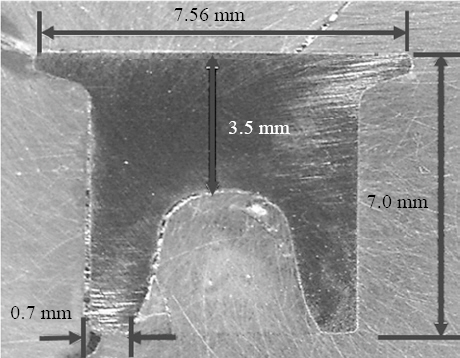
Cross section shape of HDX type rivet
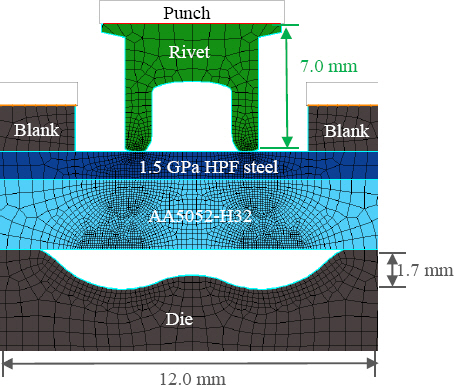
SORPAS® simulation model geometry for 1.5 GPa HPF steel and AA5053-H32 combination
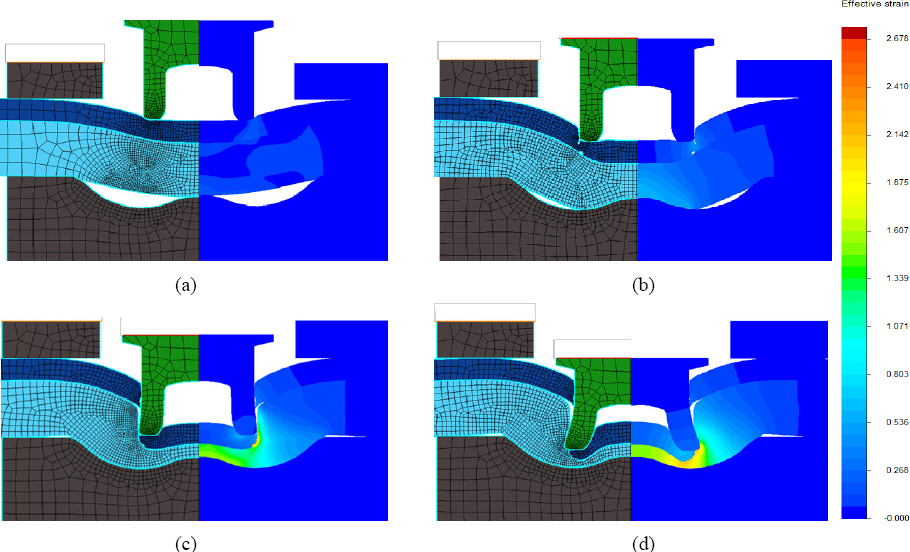
Stages of SPR joining (a) Rivet pressing the top sheet (b) Initial piercing of rivet in to sheet without any obvious deformation (c) Piercing of the bottom sheet (d) Final deformation of the rivet with interlock formation

List the rivets and dies used for the seven conditions of SPR processes for the 1.5 GPa HPF steel/AA5052 combination, along with the setting force used for each rivet and die combination
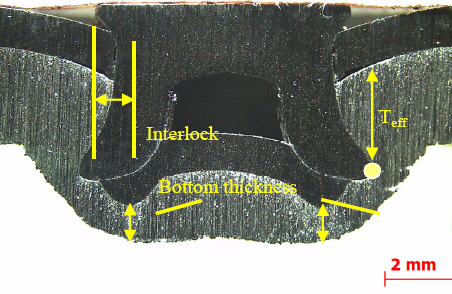
Joint of aluminum quality guidelines for cross- section of the SPR joint; Interlock, Teff, and bottom thickness, respectively
2.3 Salt spray test and shear tensile test
In this study, the salt spray test was conducted to analyze the difference in corrosion behavior between the SPR and SPR-bonded processes according to the salt spray time. Before the test, Teflon tape was applied to areas other than the joint area to inhibit the contact between the salt water and specimen as much as possible because the area to be fixed in the jig of the shear tensile test equipment may lead to fracture due to the corrosion of the base metal. The salt spray test was conducted using Visiontec’s equipment in accordance with the KS D 9502:2009 standard (5% NaCl, 35°C, 7.0 pH). The salt spray time was set to 0 hr, 240 hrs (10 days), 480 hrs (20 day), 960 hrs (40 days), and 1,440 hrs (60 days) in the 0-1,440hr (60 days) range.
The shear tensile test was conducted to observe changes in the shear tensile load and fracture mode of the joint according to the salt spray time. After the shear tensile test in accordance with the KS B 0802 standard (cross- head rate 3 mm/min, Room temperature), the derived load-displacement graph was presented. The fracture mode of the joint according to the salt spray time was observed using an optical microscope and camera imaging after fracture.
3. Experiment Results and Discussion
3.1 Joint quality evaluation
3.1.1 SPR joint quality evaluation
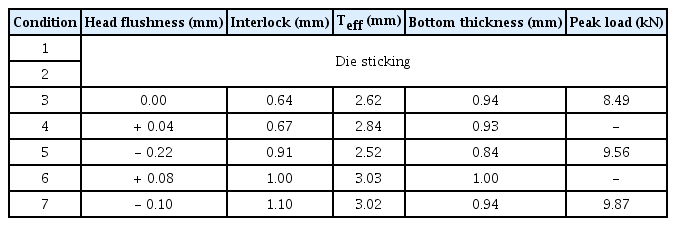
To set SPR process conditions suitable for the material combination of this study, joint quality evaluation was performed for seven process conditions as shown in Table 1. For joint quality evaluation, the joint quality factors, i.e. the head flushness, interlock, Teff, and bottom thickness, as well as the peak load, which is the shear tensile test result, were measured twice under each process condition, and reproducibility was confirmed with a maximum difference of ±0.2. The average results of the experiment are shown in Table 2. The experiment results showed that die sticking in which the deformed bottom sheet completely fills the die and sticks to it after SPR bonding occurred for A type and B type dies as shown in Fig. 6(a). The observation of the cross-sectional geometry of the three types in Fig. 6(b) indicates that this phenomenon occurs due to the penetration of the rivet through the top sheet (HPF steel) cut and lowered the HPF steel with low ductility without significant plastic deformation to form an empty space between the rivet legs (web) and the AA5052 bottom sheet completely filled the die due to the lowered HPF steel. Since both ends of the bottom sheet were bonded at an angle of approximately 90° for A type and B type dies and at approximately 120° for C type, however, die sticking did not occur to the C type die even though it was completely filled by the AA5052 bottom sheet. This indicates that bonding between a high-strength top sheet with low ductility and a bottom sheet made of a material with high moldability (e.g. 3.0mm AA5052) allows the bottom sheet to completely fill the empty space of the die due to the top sheet cut and lowered without plastic deformation, and that die sticking may occur to dies with the geometry of A and B types. Consequently, the C type die without die sticking was selected as a die type suitable for the material combination of this study.
Result of joint quality and peak load for seven combinations of SPR joints
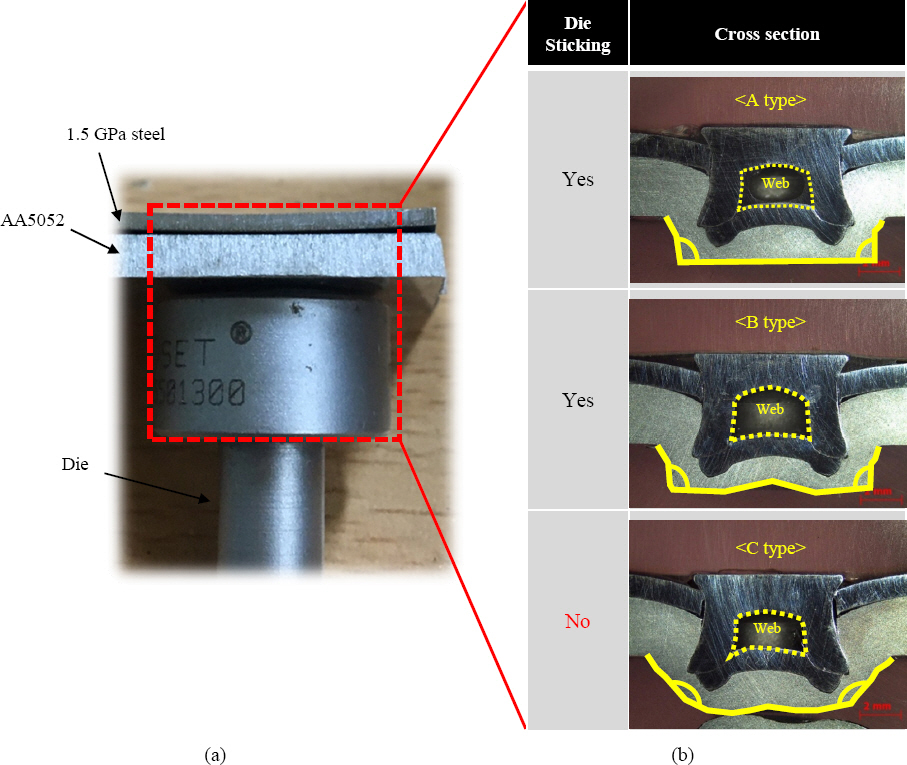
(a) Die sticking phenomenon observed from the side and (b) Die sticking phenomenon in cross section with three of different types of dies
According to Li et al.14), each joint quality criterion is as follows. The head flushness must be between -0.5 and +0.3 mm. The interlock must exceed 0.4 mm, and the bottom thickness must exceed 0.2 mm. Condition 3 satisfied the joint quality criteria with a head flushness of 0.00 mm, an interlock of 0.67 mm, and a bottom thickness of 0.94 mm. To secure higher tensile strength and select optimal conditions, the die depth and rivet length were optimized as follows. According to Haque et al.15), rivet flaring increases as the die depth decreases. This is because a decrease in die depth reduces the volume of the die and the constant deformation of the bottom sheet compared to the reduced volume increases the reaction force that causes rivet flaring. Therefore, the die depth was decreased from 2.5 to 1.7 mm to increase the interlock by improving rivet flaring. Consequently, conditions 3 and 5 in Table 2 showed that the interlock increased by approximately 0.27 mm and the peak load improved by approximately 1.07 kN due to the decrease in die depth. The rivet length was increased from 6.0 to 7.0 mm to increase the bonding area between the bottom sheet and the rivet. Consequently, conditions 3 and 5 in Table 2 showed that Teff increased by approximately 0.5 mm and the peak load improved by approximately 0.31 kN. In the case of the force condition, 78 kN was applied for bonding so that the rivet head could be completely settled on the top sheet and the head flushness could be measured to be -0.01 mm or less so as to minimize the influence of the corrosion caused by the infiltration of salt water into the gap between the top sheet and rivet in the salt spray test. Based on the experiment results, condition 7 which exhibited improvements in the interlock, Teff, and peak load was selected as the optimal condition with high joint quality and the largest shear tensile load without die sticking. Under condition 7, the head flushness, interlock, Teff, and bottom thickness met quality criteria with values of -0.10, 1.10, 3.0, and 0.9 mm, and the highest interlock was secured along with the highest peak load of 9.87 kN due to the high friction effect. In the SORPAS® simulation results, the web between the rivet legs by the high-strength top sheet and the interlock between the top and bottom sheets caused by rivet flaring are observed as shown in Fig. 7(a) and 7(b).
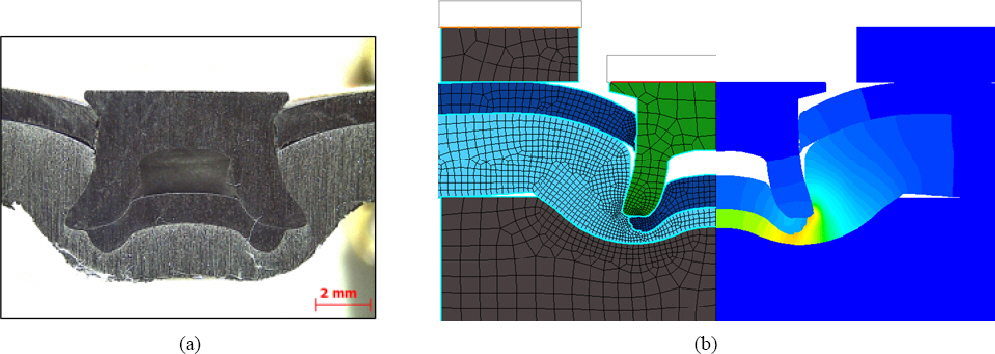
(a) Cross section of joining of 1.5 GPa HPF steel/AA5052 combination (b) The corresponding simulation results of virtual experiment
3.1.2 SPR-bonded joint quality evaluation
According to Ruijun et al.16), it is possible to change joint quality by changing the friction coefficient under the influence of the adhesive during the SPR process. Hahn et al.17) optimized process conditions by increasing the hardness and joining speed of the rivet or decreasing clamping force considering cracking in the top and bottom sheet materials under the influence of the adhesive. In this study, the HDX type rivet for high- strength steel top sheets was applied, and excellent bonding without defects, such as cracks, was secured in the cross-sectional geometry of the SPR and SPR- bonded processes as shown in Fig. 8. In the case of the SPR-bonded process specimen shown in Fig. 8(b), an improvement in friction characteristics by the adhesive is expected, but there was no difference in quality factors from the SPR process specimen as shown in Table 3. In the case of the SPR-bonded process specimen, the shear tensile test was conducted after adhesive hardening considering paint baking. In this instance, since the bonding characteristics of the adhesive at the interface between the top and bottom sheets significantly affect shear tensile strength depending on the application of cleaning to the bottom sheet surface, the shear tensile test results according to the presence or absence of the cleaning before applying the adhesive were compared and analyzed first. In the experiment results, differences in fracture mode and peak load after the shear tensile test depending on AA5052 surface cleaning were observed as shown in Fig. 9. In the case of the fracture mode, no residual adhesive was observed around the rivet due to the pressure applied during the SPR process. Under the application of A5052 surface cleaning, however, the area of the residual adhesive on the bottom sheet increased. Kang et al.18) reported that the strength of the adhesive increases as the surface roughness of the material increases due to the increase in bonding area. It is determined that the application of A5052 surface cleaning removed the Al2O3 oxide film and increased the surface roughness as well as the bonding area between the adhesive and the sheet interface, thereby increasing the bonding force. Therefore, in the case of the specimen with AA5052 surface cleaning, the cohesive failure mode in which fracture occurs at the adhesive interface rather than between the sheet interface and adhesive was observed during the shear tensile test due to the increase in bonding force between the AA5052 sheet and adhesive. The peak load also increased by approximately 3.6 kN compared to that before the application of AA5052 surface cleaning for the same reason. Based on the experiment results, for the optimal bonding force between the adhesive and the sheet interface, the SPR-bonded process specimen was prepared by applying AA5052 surface cleaning.
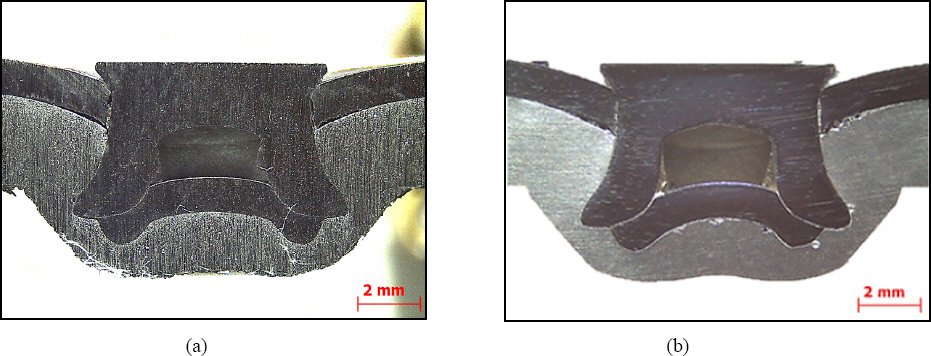
Cross section geometry (a) SPR process and (b) SPR-bonded process
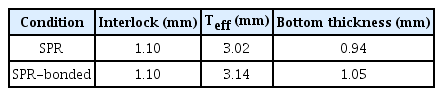
Comparison of SPR and SPR-bonded joint quality

AA5052 Shear tensile test results with or without surface cleaning application
3.2 Specimen surface corrosion state according to the salt spray time
Fig. 10 shows the surface corrosion state of the top sheet, rivet, and bottom sheet specimens near the joint according to the salt spray time. For the top sheet (HPF steel), aluminum-Si plating was applied. As in a study by Park et al.19), red and blue corrosion products were observed as salt water penetrated the Al2O3 oxide layer on the surface of HPF steel after corrosion and reacted with Fe. In particular, as shown in Fig. 11, corrosion products were easily observed near the joint when the top sheet of the specimen subjected to the tensile test was examined after 60 days of salt spray. This is because the rivet plating layer was destroyed under the physical load in the SPR process as in a study by Esfahani et al.20), or because a corrosion environment that facilitates the infiltration of salt water was formed by the corrosion of the joint gap and the galvanic coupling formed between the rivet and sheets as explained by Calabrese et al.21)
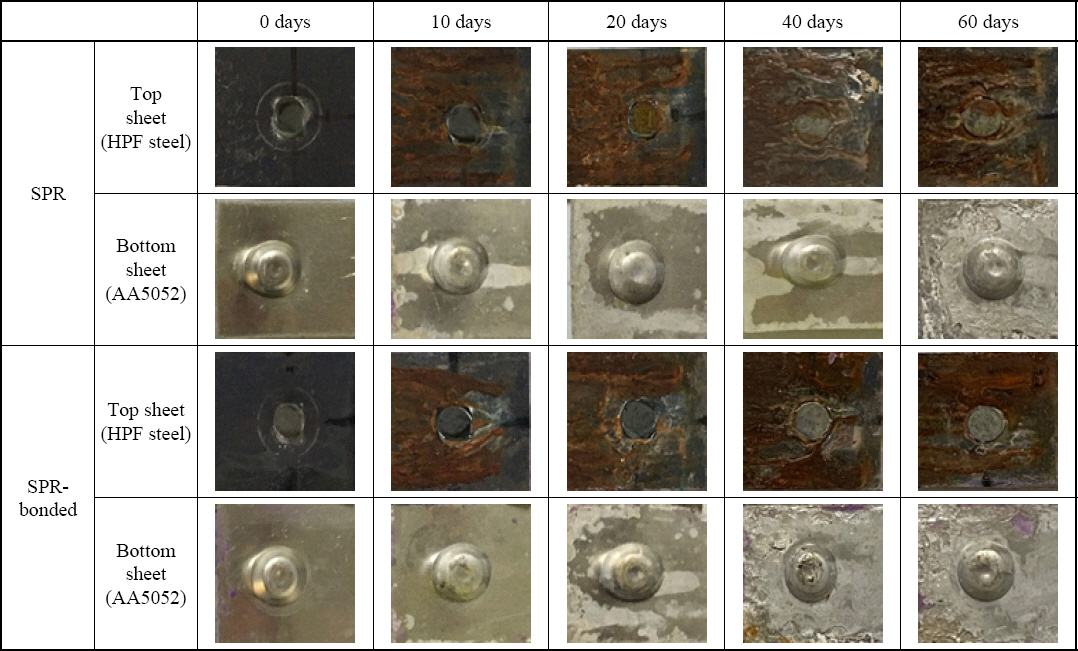
Change of corrosion state of specimen surface with salt spray time of 0, 10, 20, 40 and 60 days
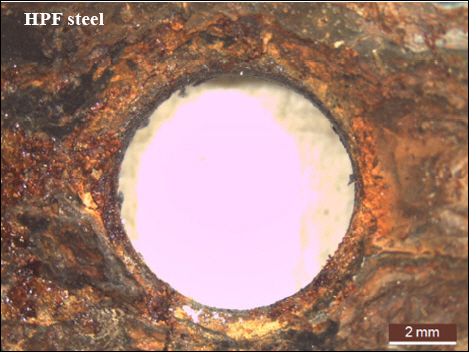
Corrosion products near top sheet (HPF steel) SPR joint subjected to tensile test after 60 days of salt spray test
The rivet was made of a Zn-Ni-plated steel. A comparison was made of the rivet head surface between the SPR and SPR-bonded processes. After a salt spray time of ten days, no red and blue corrosion product was observed on the HPF steel surface for both processes that used Zn as a galvanic anode. After 20 days, however, red and blue corrosion products were observed on the rivet head of the SPR process specimen. In the case of the SPR-bonded process specimen, however, no red and blue corrosion product was observed on the rivet head even after a salt spray time of 60 days. This is the difference depending on the presence or absence of the structural adhesive, indicating that the adhesive has the effect of inhibiting galvanic corrosion in extreme corrosion environments, such as salt spray.
In the case of the bottom sheet (AA5052), white spots were observed as corrosion products after a salt spray time of ten days for both the SPR and SPR-bonded processes. The area of the corrosion products increased as the corrosion time increased. According to Calabrese et al.22), the white spots formed on the aluminum surface after salt spray corrosion are the oxides and hydroxides (Al2O3 and Al(OH)3) of aluminum. Their thickness increases according to the corrosion time, and they affect a reduction in the strength of the joint. Since the AA5052 material of this study is a thick plate with a thickness of 3.0 mm, however, it is expected that its mechanical properties, such as tensile and yield strengths, will not be affected by the formation of corrosion products.
3.3 Evaluation of the mechanical properties of the joint according to the salt spray test time
3.3.1 Shear tensile test analysis for SPR and SPR-bonded joints
Fig. 12 shows the load-displacement graphs and peak load derived from the shear tensile test results according to the salt spray time for SPR and SPR-bonded joints. The experiment results showed that the load-displacement graph geometry of the SPR joint was constant regardless of the salt spray time, and fracture occurred with a sharp reduction in load after reaching the maximum peak load (red dot). The peak load was improved by approximately 0.6 kN after a salt spray time of ten days (Fig. 12(b)). This is because the corrosion product formed between the rivet and sheet interface by the salt water deposited during the salt spray test increased the surface roughness and friction force as reported by Li et al.23) Consequently, the peak load slightly increased due to the increase in friction force between the sheet interfaces during the shear tensile test, which is similar to the research results of Calabrese et al.10) After 60 days (Fig. 12(e)), the rivet was already fractured before the shear tensile test by the accelerated corrosion of the rivet head as with the change in specimen surface corrosion state observed in Fig. 10, and thus the tensile strength could not be measured. This indicates that red and blue corrosion on the HPF steel surface was gradually accelerated by galvanic corrosion, and that locking required for the bonding force of the rivet head and top HPF steel sheet could not be maintained due to the rapid increase in HPF steel corrosion products at a salt spray time of 60 days even though the locking was maintained until 40 days because the rivet head was still affected by the galvanic anode of the plating layer.
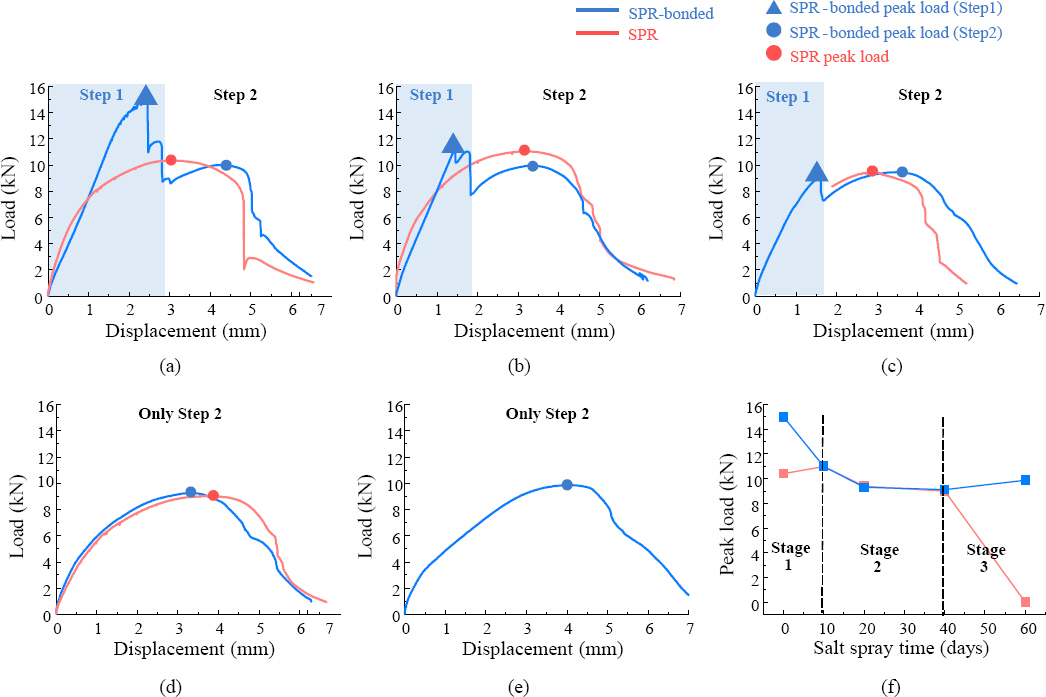
Load-displacement curve according to salt spray time of SPR and SPR-bonded process (a) 0 days, (b) 10 days, (c) 20 days, (d) 40 days, (e) 60 days, (f) Peak load according to salt spray time
As opposed to the SPR joint, the load-displacement graph geometry of the SPR-bonded joint exhibited the rise of the load by the detachment of the adhesive in step 1 and the change in load by the fracture of the SPR joint in step 2. Step 1 was observed until a salt spray time of 20 days (Fig. 12(a) to 12(c)), but it gradually decreased. The load change in step 1 was not observed and only the load change of step 2 was observed after 40 days (Fig. 12(d) to 12(e)). This indicates that bonding characteristics completely disappeared from a salt spray time of 40 days due to the decomposition of the adhesive.
In the initial ten days (Fig. 12(a) to 12(b)), the peak load in step 2 of the SPR-bonded process (blue dot) is approximately 0.5 to 1.0 kN lower than that of the SPR process (red dot). This difference is attributed to the high load applied in step 1 (blue triangle) during the fracture of the SPR joint after the detachment of the adhesive, with some of the load transferred to the SPR joint. After 60 days (Fig. 12(e)), a peak load of approximately 9.9 kN was maintained for the SPR-bonded joint unlike the SPR joint with the rivet already fractured by the corrosion of the rivet head. In the case of the SPR-bonded joint, the experiment results show that the chemical bonding force between the sheet and adhesive gradually decreased over time in corrosion environments, such as salt spray, and the function of the adhesive is lost due to a sharp reduction in chemical bonding force after 40 days (Fig. 12(d)). After 60 days (Fig. 12(e)), however, the fracture characteristics by SPR bonding were still effective for the SPR-bonded joint unlike the SPR joint and the peak load equal to that of the initial SPR joint was maintained due to the presence of the adhesive inhibiting the contact required for galvanic corrosion in the corrosion environment as with the corrosion changes of the rivet head observed in Fig. 10. The peak load change can be divided into three stages as shown in Fig. 12(f). Stage 1 shows the results before salt spray corrosion, and the peak load difference depending on the presence or absence of the adhesive is observed. In stage 2, salt spray corrosion was in progress. Thus, the SPR-bonded process specimen showed a reduction in peak load due to the sharp decrease in the chemical bonding force of the adhesive. In the case of the SPR joint, there was no significant reduction in peak load because bonding between the rivet head and HPF steel sheet was maintained despite the progress of corrosion. Therefore, the SPR and SPR- bonded processes exhibited similar peak load values. In stage 3, the rivet bonding force was still effective and a peak load of approximately 10 kN was maintained in the SPR-bonded process due to the presence of the adhesive. The bonding force of the SPR process specimen, however, decreased to 0 kN due to the rapid HPF steel sheet corrosion and rivet head corrosion, resulting in a difference.
3.3.2 Fracture mode change analysis for SPR and SPR- bonded joints
Fig. 13 shows the fracture mode according to the salt spray time for SPR and SPR-bonded joints. In the experiment results, the rivet head pull out fracture mode in which fracture occurs due to the separation of the rivet from the HPF steel top sheet was observed except for the result of the SPR joint at 60 days of salt spray. At a salt spray time of 60 days, the rivet failure fracture mode in which fracture occurs due to the damage to the rivet legs was already observed in the SPR joint before the shear tensile test. Fig. 14 shows the rivet head pull out and rivet failure fracture modes. The cause of each fracture mode was analyzed as follows.
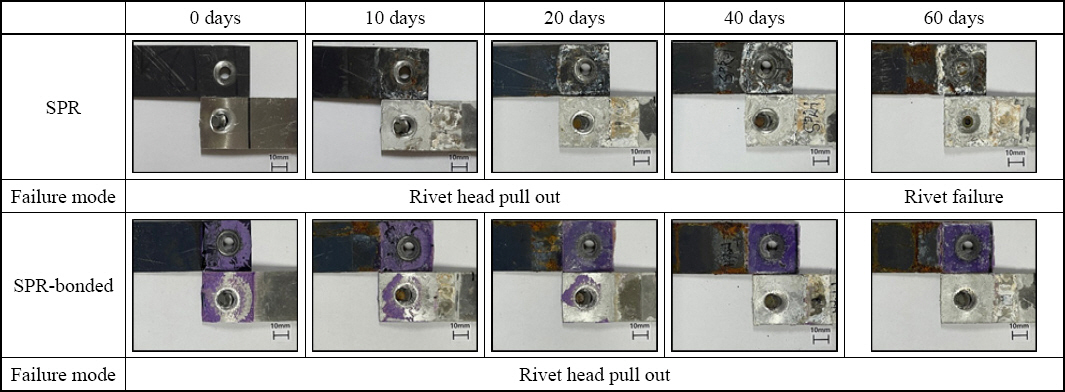
Fracture mode with spraying time of 0, 10, 20, 40 and 60 days for SPR and SPR-bonded process

(a) Rivet head pull out and (b) Rivet failure fracture mode in the top and bottom sheet
Fig. 14(a) shows the rivet head pull out fracture mode. The fracture geometry shows that relatively considerable deformation occurred to the bottom sheet while the deformation of the top sheet was not significant. Fracture, however, occurred as the rivet was separated from the top sheet due to the damage to the rivet head. This occurred because stress was concentrated on the rivet head despite the considerable deformation of the bottom sheet caused by the formation of clamping force between the rivet and bottom sheet with an interlock of approximately 1.10 mm through the SPR process optimization process. Fig. 14(b) shows the rivet failure fracture mode. This fracture mode was observed only in the SPR joint after a salt spray time of 60 days. It occurs due to the difference between the SPR and SPR-bonded processes. In other words, galvanic corrosion was accelerated by the process difference, and the cause was analyzed from three galvanic coupling perspectives in which the infiltration of salt water between steel and aluminum can cause galvanic corrosion as in a study by Calabrese et al.10).
Fig. 15 shows the schematic diagram of three galvanic coupling regions that occur at the SPR joint between steel and aluminum. Calabrese et al.10) mentioned that the corrosion of the third galvanic coupling region decreases the clamping force between the rivet and bottom sheet as the corrosion time increases. The rivet failure fracture mode was observed from the SPR process after 60 days of salt spray because the clamping force with the bottom sheet could not be maintained due to the accelerated corrosion of the third galvanic coupling region in Fig. 15 caused by potential differences among the rivet, top sheet, and bottom sheet. In the case of the SPR-bonded process, the adhesive prevented the accelerated corrosion of the rivet legs because it was applied to the space between the top and bottom sheets, which affect the third galvanic coupling region in Fig. 15. Consequently, even after a salt spray time of 60 days, a shear tensile strength of approximately 9.9 kN was maintained and the rivet head pull out fracture mode was observed because the acceleration of the rivet leg corrosion was mitigated compared to the SPR process specimen.
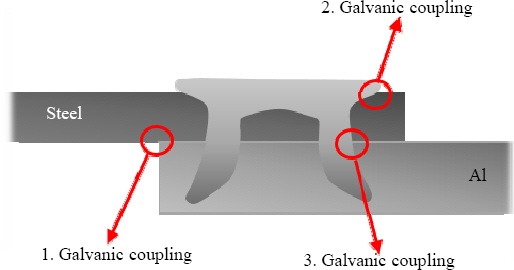
Schematic diagram of the three galvanic coupling regions occurring at the Steel-Aluminum combination SPR joint
Since the bonding force of the adhesive has a significant impact on shear tensile strength in the SPR-bonded process, the fracture mode change was analyzed by comparing changes in adhesive area remaining on the surface of the bottom sheet after the shear tensile test according to the salt spray time as shown in Fig. 16. In the fracture mode analysis results, most of the adhesive was separated from the bottom sheet surface and a relatively small adhesive area was observed. As the salt spray time increased, the adhesive area linearly decreased. After a salt spray time of 40 days, no residual adhesive was observed on the bottom sheet surface. When these experiment results were interpreted together with the load-displacement graphs according to the salt spray time in the SPR-bonded process shown in Fig. 12, the finding that no load increase was observed in the load-displacement graphs after 40 days of salt spray due to the detachment of the adhesive shows the same tendency as the finding that no residual adhesive was observed on the bottom sheet surface. As shown in the schematic diagram of Fig. 17, the adhesive failure mode in which fracture occurs between the bottom sheet surface and adhesive is the main factor in the shear tensile test as the salt spray time increases in the SPR-bonded process specimen, indicating that the bonding force between the bottom sheet surface and adhesive was rapidly reduced by the infiltration of salt water.
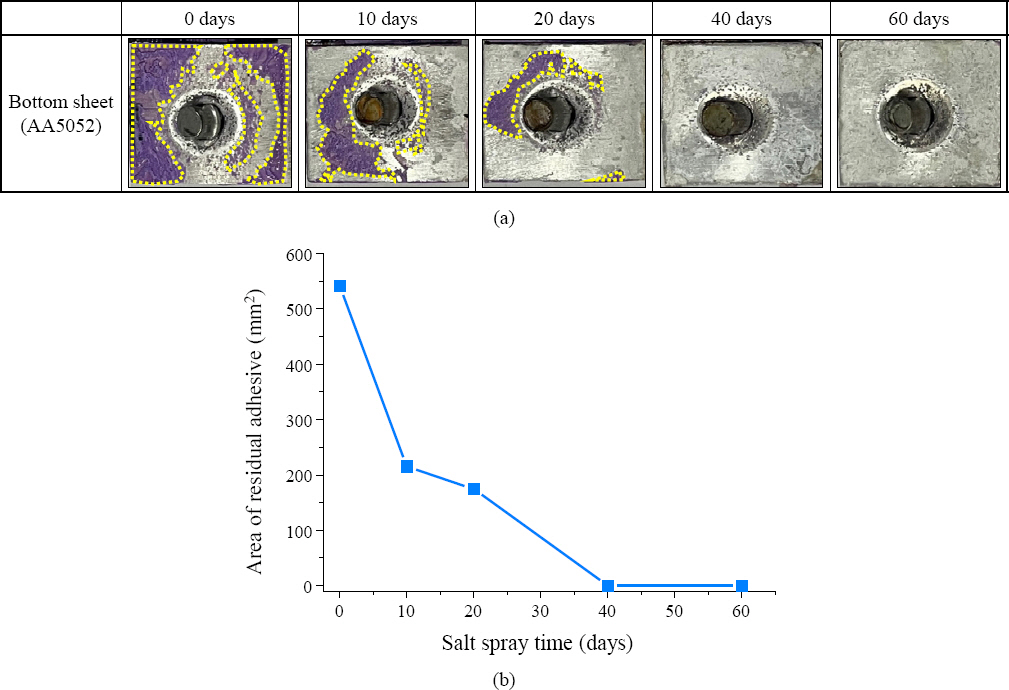
(a) Changes in adhesive area remaining on the surface of bottom sheet(AA5052) and (b) Measured area of residual adhesive with salt spray time
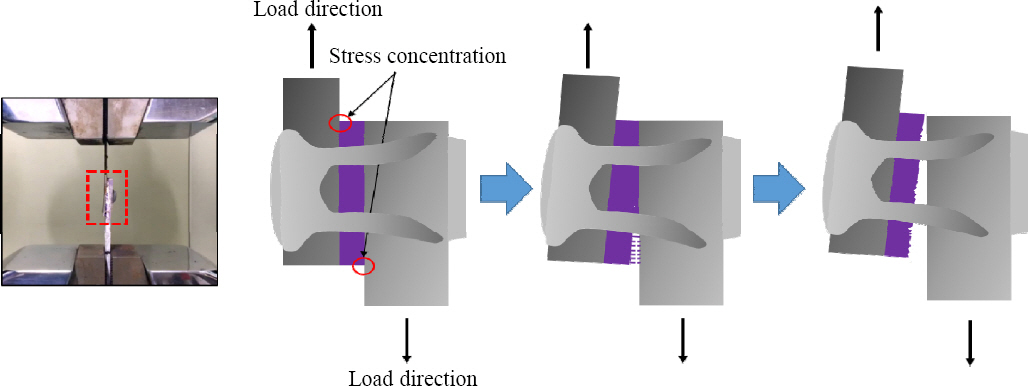
Schematic diagram of adhesive failure mode in shear tensile test
4. Conclusion
In this study, the self-piercing rivet (SPR) process conditions were optimized for the combination of 1.5GPa hot press forming (HPF) steel and AA5052, and changes in shear tensile strength and fracture mode according to the salt spray time were investigated for SPR and SPR-bonded process specimens. The obtained results are as follows.
1) The plastic deformation behavior of the bottom sheet for each SPR process stage was identified through the SPR process analysis. Based on these results, optimal process conditions were set. In the experiment results, die sticking occurred depending on the die geometry. It was possible to secure joint quality conditions that exhibit a shear tensile strength of approximately 9.87 kN by improving the interlock and Teff through a decrease in die depth and an increase in rivet length, respectively. In the SPR-bonded process in which the structural adhesive was mixed, the shear tensile strength increased by approximately 3.6 kN due to the application of AA5052 surface cleaning and adhesive. This indicates that aluminum sheet surface cleaning is essential for securing additional bonding strength in the SPR-bonded process.
2) After salt spray, red and blue corrosion products were observed on the surface of HPF steel due to the reaction between Fe and salt water, and the oxides and hydroxides (Al2O3 and Al(OH)3) of aluminum were observed as the corrosion products of white spots on the surface of AA5052. Red and blue corrosion products were also observed from the rivet head as with HPF steel. In the case of the SPR-bonded process specimen, however, the corrosion rate was slow for both the rivet head and HPF steel compared to the SPR process specimen. This appears to be due to the galvanic corrosion reduction effect caused by the presence of the adhesive.
3) The load-displacement behavior of the SPR-bonded process specimen in the shear tensile test can be divided into the two steps caused by the detachment of the adhesive and the fracture of the SPR joint (steps 1 and 2). After 40 days of salt spray, the load increase caused by the detachment of the adhesive in step 1 was no longer observed. After 60 days, the SPR joint showed the rivet failure fracture mode due to the accelerated corrosion of the rivet legs, resulting in no load bearing capacity. The SPR-bonded joint, however, exhibited a peak load of approximately 9.9 kN because SPR joint locking was maintained due to the galvanic coupling effect by the adhesive.
4) As for the fracture modes, two types (rivet head pull out and rivet failure) were observed due to the corrosion mitigation effect of the adhesive, which was present in the galvanic coupling regions formed by potential differences among the rivet, top sheet, and bottom sheet. In addition, in the SPR-bonded process, the adhesive failure mode in which fracture occurs between the bottom sheet surface and adhesive was observed after the shear tensile test, and the linear relationship between the residual adhesive area and shear tensile strength was confirmed.
5) The SPR-bonded process with surface cleaning may attain an additional enhancement in initial bonding strength due to the application of the adhesive. Especially in the salt spray corrosion environment, the presence of the adhesive made it possible to maintain bonding strength and the rivet head pull out mode by minimizing galvanic coupling through the inhibition of salt water infiltration and suppressing the rivet leg corrosion.
Acknowledgement
This work was supported by the “heterogeneous metal bonding technology development for lightweight eco- friendly vehicle chassis” program funded by the Ministry of Trade, Industry and Energy (No. 20017415) and the “Grand ICT research center” program funded by the Ministry of Science and ICT and the Institute of Information and Communications Technology Planning and Evaluation (IITP-2023-2020-0-01791).