A Study on the Optimization of Welding Parameters for Titanium Drums Using Optimization Algorithms
Article information

Abstract
An electrolytic copper foil uses titanium drums, which exhibit excellent corrosion resistance and can produce thin electrodeposited copper foils. The appropriate technology for producing thin copper foils is required as electronic products become lighter, thinner, shorter, and smaller. Thus, the importance of titanium drum manufacturing technology, which affects the specifications of electrolytic copper foils, is emphasized. In this study, thermo-elastic-plastic analysis is performed to select an appropriate range of welding process parameters for titanium drums. In addition, using a range of welding process variables derived from analysis, GBO and GPS algorithms, which are optimization algorithms, are developed to derive objective and restriction functions as well as to select the optimal algorithm.
1. Introduction
With the miniaturization and multifunctionalization of electronic products and the development of mobile information technology (IT), electric vehicles, intelligent robots, and green energy industries, demand for flexible printed circuit board secondary batteries advantageous for achieving more flexible, lighter, thinner, shorter, and smaller printed circuit boards with fine pitch from rigid PCBs is continuously increasing. Copper foil is an essential material used in the production of negative electrode materials for secondary batteries that can be used semi-permanently through the flexible copper-clad laminate of the flexible printed circuit board, which is a wiring board using an insulated board with flexibility and charging1-4).
Due to the characteristic that thinner copper foil allows coating with more negative electrode active materials, the trend is to prefer the thin thickness of the copper foil to increase the capacity and light weight of the secondary battery. Manufacturing thin copper foil is a key technology for secondary battery development, and the thinner it is, the higher the efficiency of the secondary battery and the lower the weight of the product. However, in order to adjust the thickness of copper foil to 1/15 of the thickness of human hair, advanced process technology and facility competitiveness are required. Thin copper foil used to be produced as rolled copper foil in the past, but recently, electrodeposited (ED) copper foil has been used as it is cheaper to produce than rolled copper foil and is advantageous to make it light, thin, short, and small5).
The key process in the manufacturing process of ED copper foil is the electrodeposition process of Cu on the surface of the cathode drum, and the specifications of the copper foil are affected by the specifications of the cathode drum used6,7). The cathode for manufacturing ED copper foil uses lead, which has excellent corrosion resistance on the surface oxide film and is easy to cast. For weight reduction and miniaturization of various precision electric and electronic equipment, such as computers and communication equipment, the thickness of copper foil is becoming ultra-precise. In addition, in order to increase the abrasion and corrosion resistance of the current anode, lead is gradually being replaced by titanium8). Accordingly, the importance of titanium drum production technology that affects the specification of ED copper foil is being emphasized, with a pressing need for the development of related technology.
A problem in the titanium drum production process is that stains or discoloration may occur during the production process of the electrolytic copper foil due to the heat-affected zone during the welding process. There is a problem in that the quality of the copper foil has greatly deteriorated due to the occurrence of hot spot defects in the current density operating range. The problem of the heat-affected zone by titanium drum welding must be combined with academic content from various fields, including theoretical, technical, and practical areas. In the manufacturing process, it is urgent to identify the heat-affected zone that appears according to the welding process variables and to study the mutual effects of the welding process variables.
In a study related to this, Kim attempted to understand the effect of process variables during overlapping laser welding of titanium thin plates. A CP Ti gr.1 plate with a thickness of 0.5 mm was used as a material for welding, and the length, microstructure, and microhardness of the welded zone were compared while changing process variables such as laser output and feed speed9). Park et al.10) defined the objective function and the fit function considering weldability and productivity, searched for the point where the fit function was maximized using a genetic algorithm, and designed the optimal welding process variable based on the results. Kang et al.11) used deep learning to learn welding process variable data such as welding current, arc voltage, and pressure that can be obtained during welding to predict weldability. Kim et al.12) analyzed the mechanical and structural characteristics of the welded zone according to the welding condition variables and suggested the appropriate welding conditions according to the situation based on the results.
Yoon et al.13) performed thermal conduction analysis and thermo-elasto-plastic analysis to analyze welds using the finite element method. Through this, the effect of the residual stress and deformation caused by the cutting process on the welding process was identified. Oh et al.14) analyzed the effect of the heat input model and material hardening model application conditions for GTA welding conditions, which were widely applied in industrial settings, on the results of welding analysis using finite elements. Kim et al.15) studied the deformation and residual stress caused by welding through finite element analysis, and derived the optimal welding conditions that minimized them. Kang et al.16) calculated the heat source value required for the analysis using the temperature data measured through the experiment during the heat transfer analysis of friction stir welding and optimized the process variable by applying it to the thermoplastic analysis.
Until now, many studies have been conducted on the quality of welding parts according to the titanium welding process variables. Research on selecting the optimal welding conditions to apply the welding technology by identifying the heat-affected zone in the manufacturing process of the titanium drum is at an insufficient level. Therefore, there is a need for a technology that can predict the welding process of a titanium drum through thermo-elasto-plastic analysis and select welding process variables that can derive the optimal welded part.
In this study, an appropriate range of welding process variables for a titanium drum was selected, and heat transfer analysis and thermal stress analysis were performed using Ansys software to analyze the temperature distribution, deformation amount, maximum stress, and safety factor of the heat-affected zone according to each welding process variable. In addition, by using the range of welding process variables derived through analysis, gradient-based optimizer (GBO) and generalized-pattern search (GPS) algorithms, which were optimization techniques, were developed to derive objective and constraint functions and select the optimal algorithm. Through this, the appropriate welding process variables of welding current and arc voltage used in the welding process of the titanium drum were calculated.
2. Thermo-elasto-plastic analysis
The failure of a material depends on the interaction of stress with catastrophic failure, and essentially the stress is determined by the weakest link in the material, which is more likely to increase as the volume of the material increases. Unlike material properties such as yield strength and modulus of elasticity, size effects are related to thin surface layers of materials subjected to stresses of 95% or more of the maximum surface stress. As a bulky material has a gentle stress gradient, the volume portion subject to high stress increases, thereby increasing the possibility of cracking in bulky materials. Since the concept of the stressed volume is important when considering the stress gradient due to the stress concentration, research on thermo-elasto-plastic analysis for predicting it in advance is necessary.
In the manufacturing process of the titanium drum used for ED copper foil, the parts to which the welding process is applied are the side plate and the titanium cylinder located outside, and after the welding process, the inside of the drum must have a structure with uniform conductivity. In addition, since the titanium drum welding process affects copper foil manufacturing, it is necessary to perform simulations to ensure safety by considering maximum strain and stress through ductile analysis. Therefore, an attempt was made to derive welding process variables that could minimize thermal deformation through thermal elasto-plastic analysis using Ansys software, and welding current and arc voltage were used as input values for the welding process variables. Fig. 1 shows the analysis model for the thermal elasto-plastic analysis of the titanium drum welded zone, and the material used for the thermal elasto-plastic analysis was set to Titanium grade 1.
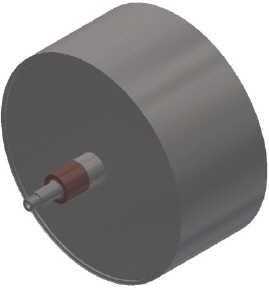
The 3D modeling of a titanium drum
For the mesh for thermal elasto-plastic analysis, curvature was applied with advanced sizing so that the mesh could gather around the curvature to check the expected deformation and stress result values after thermal elasto-plastic analysis in detail and accurately. In order to improve the density of edges, the span angle center was set to a fine mesh. Finite element modeling (FEM) of titanium drum welded zone was performed by selecting the size of the mesh as 10 mm, and the mesh quality was confirmed to be 99%. Fig. 2 shows the model with the mesh created. As a result of the mesh creation of the titanium drum, the total number of nodes was 981,870 and the number of elements was 828,652. The size of the Ti drum model was selected as 3,000 mm, which was the size used in the actual field.
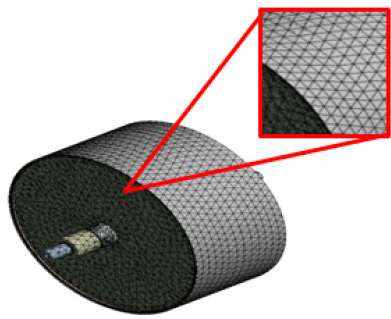
Generating a mesh of titanium drum
Boundary conditions in thermo-elasto-plastic analysis are composed of constraint conditions, but it is impossible to simultaneously apply displacement constraint conditions and load conditions to nodes. In general, either displacement constraints or load conditions are applied to all nodes. If no conditions are applied, it means that a load of 0 is applied to the node. Each component shared a node by setting the bonded condition.
In the thermal elasto-plastic analysis of titanium drum welding, the analysis was performed using moving heat flux as the boundary condition. As the moving heat flux input value, the path the heat source moves was set, and the starting point of the heat source was specified. In addition, “first patch” and “last patch” were set in order for the input values to be well applied and converted in the moving heat flux analysis. Next, the speed, diameter, and heat input of the heat source derived through the experiment were set, and the start and end times of welding were entered. The end time was set to 10 minutes, and the analysis was conducted in consideration of cooling after welding. Tables 1 and 2 show the input values for the thermal elasto-plastic analysis of the titanium drum.

The simulation plan for the trend of parameter

Thermal-structural analysis boundary condition
For titanium drum welding analysis, Goldak’s double elliptic heat source model, which well reflects the general arc characteristics, was used as the welding heat source model, and the following equations (1) to (3) were used for heat flux (qf,r).
Where, Q denotes the heat power, η denotes the welding efficiency, a denotes the width of the melted zone, b denotes the depth of the heat flux, c denotes the total length of the heat flux, and cf,r denotes the length before and after the heat flux. According to Goldak, the width (a) and depth (b) can be obtained through the molten pool shape, suggesting that the length of the front quadrant (cf) be taken as half the width and the length of the back quadrant (cr) as twice the width. Ff and fr in Equation (4) mean the volume fraction in the anterior and posterior ellipsoidal areas of the total heat source, and the sum of the two is defined as 2, and the efficiency of the GTA welding arc was determined to be 36%, which is similar to the heat input efficiency (21 to 48%) of GTA welding proposed in previous research results17).
Based on the selected case, the temperature of the titanium drum welded zone was confirmed through heat transfer analysis. In addition, based on the results of heat transfer analysis, thermal stress analysis was performed, and the amount of deformation, maximum stress, and safety factor were confirmed.
Figs. 3 and 4 represent the results of heat transfer analysis and thermal stress analysis of Case 1 among 12 cases. Table 3 shows the analysis results for each case, and the highest safety factor was confirmed in Case 12.
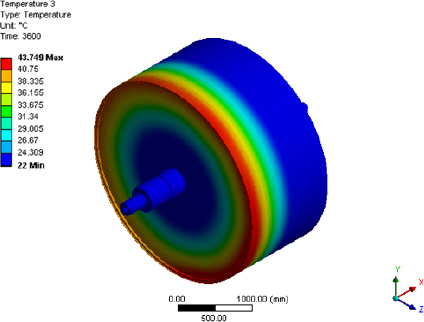
Heat transfer analysis result
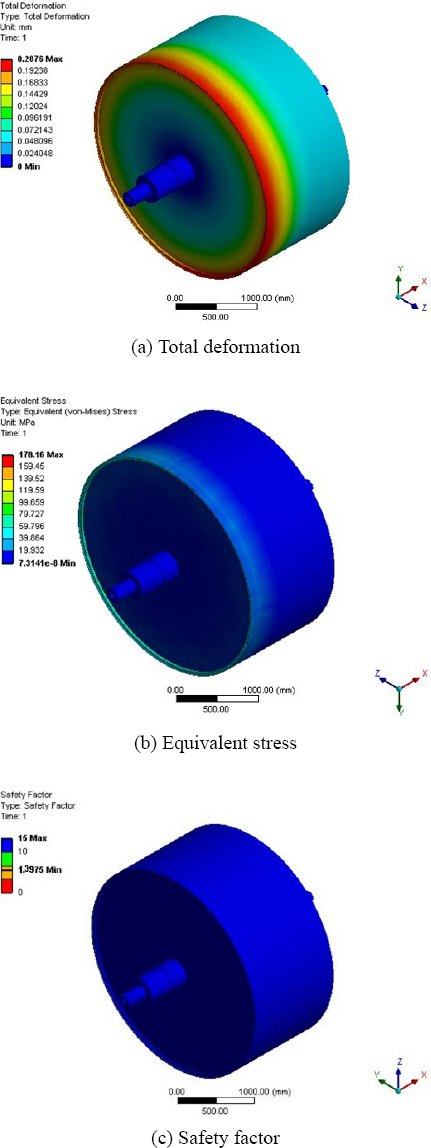
Thermal stress analysis result

Results of thermal-structural analysis
3. Results and Discussion
3.1 Optimization of welding process variables using GBO
For the titanium drum welded zone, a safety factor of 1.5 or higher must be satisfied according to the Korean Standards and Certification18). Therefore, a safety factor of 1.5 was set as the minimum constraint, and it was intended to derive the welding process variables that satisfied the minimum strain as well as the maximum stress. By performing optimization based on the results of simulation, a deterministic optimum could be derived from the initial design, and using the optimization technique, it was possible to derive an optimal design that met the required quality level by considering uncertainty.
Optimization of the conventional welding process variables applied the trial and error method based on the target system based on the operator’s intuition, experience, and prior investigation. Since the variables for optimizing the welding process variables of the optimal titanium drum are complex and the interaction is very large, the trial and error method implies the possibility of inducing inappropriate optimal values. This method is very uneconomical and requires a lot of time and effort consumed in repetitive processes. Optimization techniques are used to overcome the disadvantages of the existing methods. The optimization technique refers to a series of processes to have the optimal conditions for the welding process of a titanium drum by modifying the welding process variables using a mathematically expressed algorithm instead of removing the empirical aspects of the existing method. The process of optimizing a system using optimization techniques largely requires two elements: an objective function and constraints.
The objective function is a mathematical model for the characteristics of the system, and the constraints represent conditions that the variables of the system can have. Therefore, Equation (5), Equation (6), and Equation (7) represent the objective function f(x) of an arbitrary system with as a variable, respectively, and the constraints and ranges necessary to optimize this function.
Where, C and V denote n variables used when selecting the optimal welding process variable conditions for a titanium drum, and DLo, ELo, SLo, Sup denotes the lower and upper limits of each derived result. In the optimization development stage, high-efficiency analysis factors must be selected by choosing optimization techniques for weighting, active functions, and function tolerance. In order to properly drive the optimization technique, various function tolerances are randomly set. It is necessary to check the variables that derive the optimal design using these methods, and if the factors are not converged during the analysis according to the optimization technique, the function tolerances must be re-selected. The input values were configured to derive the optimal welding process variables of the titanium drum used for ED copper foil. As the main input data to be input to the objective function, the input and output variables prepared through the thermal elasto-plastic analysis performed above were used.
GBO finds an optimal solution based on a genetic algorithm, determines the objective function and constraints of a given system, defines the nature of the optimization problem according to the calculation procedure, and uses an appropriate optimization technique. The genetic algorithm (GA) has the characteristics of a simulation evolution type search algorithm that finds an optimal solution of an objective function. Existing optimization techniques are search methods that start from one point and find the next point, with the disadvantage of easily falling into local optima. However, since the gradient-based optimization method searches simultaneously in a group, global optima can be induced by exchanging information between excellent candidates in parallel while maintaining an appropriate level of diversity in a wider area. Theoretical research on GBO convergence analysis was based on Schema theory, and searching for the optimal string was carried out while increasing the population size with the instance of the optimal string in the Schema competition process. Based on this theorem, Fig. 5 shows the program schematic of the GBO optimization technique19).
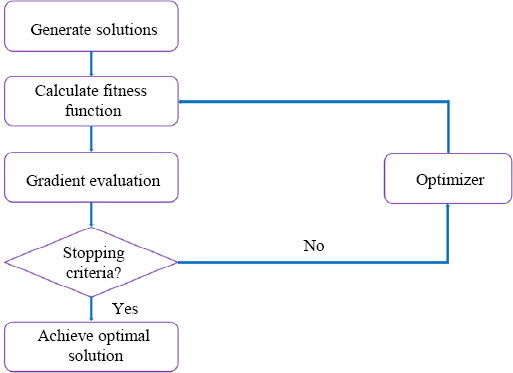
A flow chart for GBO method to predicting welding parameters
The range values for welding current and arc voltage used in the GBO technique were selected from the minimum [80 A, 22 V] to the maximum [100 A, 25 V] and were configured to reduce the errors in the welding process variable results through continuous repetitive calculation, and then to stop the calculation at the part where the change was stabilized. The variables used in the objective function were selected as welding current and arc voltage, which were considered being the main factors in the welding process, and a regression model was used for the maximum deformation, maximum stress, and safety factor formed by these variables. The upper and lower limit values of the variables of the limiting function were selected to ensure that they satisfied the safety factor of 1.5 or higher required by the Korean Standards and Certification, and that they satisfied the maximum strain and maximum stress according to the variables. Table 4 shows variables of the GBO optimization technique, and Table 5 shows the optimization results. Whether the constraints are satisfied is shown in Fig. 6 and Fig. 7.

GBO method parameters and their values

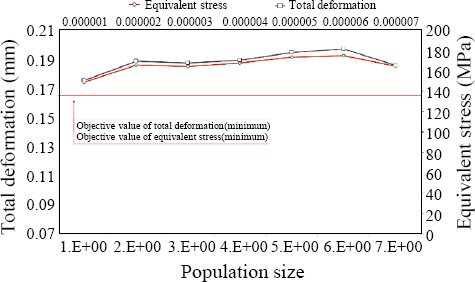
The results of various population size using GBO method

The results of GBO method for maximum deformation and maximum equivalent stress

Comparison for error of constraint and safety factor using GBO method
In Fig. 6, constraints that satisfied the conditions of maximum deformation within the range of 0~0.21 mm, maximum stress value within the range of 0~190 MPa, and safety factor within the range of 1.5~1.68 according to the change in population size were selected by applying the GBO optimization technique. As shown in Fig. 7, the error rates of the constraints according to the population size were compared and analyzed, and the optimal welding process variable was selected according to the safety factor of 1.5, which was a requirement. Based on each calculated welding process variable, a condition with a safety factor of 1.5 or more was selected among the population size, showing an error rate within 1% in predicting the safety factor. When the safety factor satisfies the safety factor of 1.5 and the maximum deformation amount is at the minimum, there is a difference of 3.06×10⁻⁴mm in the maximum deformation amount when the population size is 2.E-06 and 3.E-05. However, the maximum stress was about 0.25 MPa higher, so the optimal welding process variables were selected as a welding current of 81.19 A and an arc voltage of 25 V.
3.2 Optimization of welding process variables using GPS
The pattern search technique is a direct search method for finding a global optimization solution and does not require differentiation. However, unlike the genetic algorithm and simulated annealing, which are stochastic optimization methods, the search direction is determined by the addition or subtraction of the target function according to the deterministic rules. After the pattern search method was developed by Hooke and Jeeves in 1961, a method of controlling the size of the mesh was proposed by Fermi and Metropolis of Los Alamos National Laboratory (LANL). As shown in Fig. 8, this pattern search finds a solution through pattern generation, mesh size determination, polling, expansion and contraction, etc. As the first step, an arbitrary search may be conducted, which uses a direction vector as a method of searching neighboring regions to find a better solution than the current one.

Pattern search flow chart
The search for neighborhoods is usually done in a set defined as a mesh, and the size of the mesh determines the distance of the neighborhood. This mesh size is an important factor in finding a search solution and determines whether the solution converges locally or globally. Polling is a method of setting the best adjacent solution as a solution in the next step in the process of searching for adjacent solutions, or a method of immediately using that solution as a solution in the next step as soon as a good solution is found. If a solution that is better than the current solution is found, it is called successful polling and reduces the mesh size. However, if a solution that is worse than the adjacent one is found, it is called unsuccessful polling and increases the mesh size to find the best solution20).
The GPS optimization technique was applied and calculated using Matlab, and each function tolerance was applied using 12 analysis result data. In the GPS method, the range values for welding current and arc voltage were selected from the minimum [80 A, 22 V] to the maximum [100 A, 25 V]. Repeated calculations were continuously performed to reduce the error as a result of the welding process variable, and then the calculation was stopped at the part where the reduction of the net was stabilized. The variables used in the objective function were applied in the same way as in the GBO technique, and the upper and lower limit values of the variables of the limiting function were also applied in the same way.
In order to improve the applicability of the GPS optimization technique, functional tolerances were applied in various ways. Table 6 shows the welding process variables. Table 7 shows results calculated by the GPS optimization technique, and Fig. 9 and Fig. 10 show the graphs to check whether the constraints are satisfied. The optimal welding process variables for the titanium drum welding process were identified based on this.

GPS method parameters and their values

The results of various population sizes using GPS method
The results of GPS method for maximum deformation and maximum equivalent stress

Comparison for error of constraint and safety factor using GPS method
The results of applying the GPS optimization technique are shown in Fig. 9 and Fig. 10, and the constraints according to population size were compared and analyzed in the same way as the GBO optimization technique. Based on each calculated welding process variable, welding process variables with a safety factor of 1.5 or more were selected among the population size, showing an error rate within 1% in predicting the safety factor.
When the safety factor satisfies the safety factor of 1.5 and the maximum deformation amount is at the minimum, there is a difference of 3.06×10⁻⁴mm in the maximum deformation amount when the population size is 2.E-06 and 3.E-05. However, the maximum stress was about 0.25 MPa higher, so the optimal welding process parameters were selected as a welding current of 81.19 A and an arc voltage of 25 V.
3.3 Optimal algorithm selection
In order to evaluate the predictive ability of GBO and GPS techniques and select the optimal algorithm, as a result of analyzing the maximum deformation, maximum stress, and safety factor prediction accuracy based on the transient thermal-static structural coupling analysis results, the welding current of 98.76 A and the arc voltage of 22.00 V were selected as the optimal welding process variables according to the GBO technique, as the GBO technique showed an error rate of less than 1.2% and satisfied the safety factor of 1.5 or higher. In the previous study by Yun, GBO and GPS algorithms were developed and compared using data extracted through welding experiments, and the GBO algorithm, which can reduce the required time and error, was found to be more effective than the GPS algorithm21).
4. Conclusion
In the welding process of the titanium drum applied to the production of ED copper foil for secondary batteries, transient thermal-static structural coupling analysis was used to predict the effect of the welding part according to the temperature distribution and welding process variables. In addition, through the development of GBO and GPS techniques, which were optimization algorithms, optimal working conditions were selected to prevent defects in welds and secure weld integrity and structural safety.
1) As a result of performing thermal elasto-plastic analysis of the titanium drum, the maximum deformation amount of the titanium drum was 0.21 mm in Case 2, and the minimum deformation amount was 0.18 mm in Case 12. The maximum stress appeared at the lower end of the 178.16 MPa titanium drum in Case 1, and the safety factor was the highest at 1.68 in Case 12.
2) The optimal welding process variables for the titanium drum were selected by setting the objective function and limit function of the welding process variables using the GBO technique. The optimal population size that satisfied the safety factor of 1.5 and the minimum deformation amount was selected as 2.E-06. The optimal welding process variables were selected as a welding current of 81.19 A and an arc voltage of 25 V.
3) The optimal welding process variable conditions for the titanium drum were selected by setting the objective function and limit function of the welding process variables using the GPS technique. As the optimal mesh size that satisfied the minimum values of the safety factor and deformation, 3.E-06 was derived. The optimal welding process variables were selected as welding current (89.90 A) and arc voltage (23.92 A).
Acknowledgment
This work was supported by the material&components technology development program (No. 20010658, Deve- lopment of Commercialization Technology for Titanium Cathode Drum to Manufacture Copper Foil Used in Electic Vehicle Batteries) funded By the Ministry of Trade, industry & Energy(MOTIE, Korea)