Warning: fopen(/home/virtual/kwjs/journal/upload/ip_log/ip_log_2024-04.txt): failed to open stream: Permission denied in /home/virtual/lib/view_data.php on line 88 Warning: fwrite() expects parameter 1 to be resource, boolean given in /home/virtual/lib/view_data.php on line 89 A Study on the Weldability of Cylindrical Secondary Battery Material using Green Laser

J Weld Join > Volume 42(1); 2024 > Article
Yoo, Park, Jeon, Kim, Kim, and Kang: A Study on the Weldability of Cylindrical Secondary Battery Material using Green Laser

Abstract

This study investigates a green laser welding on a nickel-coated copper-mild steel material used in an electric vehicle battery. The laser power and scan speed were varied, and through optical microscopy, it was demonstrated that excessive heat input led to increased weld penetration depth and bead width. Regarding defects, excessive heat input caused the formation of oxide, spatter on the bead surface, as well as porosity and cracks inside the weld penetration depth. The mechanical properties were evaluated through shear stress and microhardness measurements, indicating that as the heat input increased, the mechanical properties improved for the sample welded under the 2 kW condition. Considering the fire risk (occur at weld penetration depth over 50%) and joining aspects (start at weld penetration depth higher 20%), the optimal conditions were set as 1.6 kW and 300 mm/s. This optimized condition was set as the reference for monitoring. Based on the optimized condition, the results shown that an increase in heat input led to increased plasma and temperature signals, and an increase in scanning speed resulted in an increase in reflected light signal.

1. Introduction

Regulations on CO2 emissions have been reinforced due to the global warming problem caused by the use of fossil fuels and increased CO2 emissions worldwide1,2). This has led to the development and commercialization of eco-friendly vehicles in the automobile industry, and there is growing interest in the efficiency and stability of electric vehicles3).
Electric vehicles generally use lithium-ion batteries due to their high energy density, and the batteries are divided into prismatic, pouch, and cylindrical types. These batteries consist of hundreds or thousands of battery cells, and use busbars for electrical connections4). In general, battery tabs and busbars use copper, a material with high conductivity. Battery tabs can also use copper and aluminum for weight reduction while battery cans can use steel in terms of mechanical strength and corrosion resistance. The welding process is applied for the connection between battery cans and busbars, and studies have been conducted on various welding processes, such as resistance, ultrasonic, Tungsten Inert Gas (TIG), and laser welding5,6).
Among them, laser welding is suitable for welding of electric vehicle batteries because it is non-contact and enables high efficiency, a small heat-affected zone (HAZ), high welding speed, and high-quality welding7). Martin J. Brand et al.7) compared resistance, ultrasonic, and laser welding. They reported that laser welding is superior due to low electrical resistance and high bond strength. In addition, many studies have been conducted on the welding of cylindrical battery tabs and busbars using conventional infrared (IR) lasers 8,9).
Usama F. Shaikh et al.8) conducted research on the welding processes of copper, steel, and aluminum using a Quasi-Continuous Wave (Q-CW) IR laser. They also studied mechanical, electrical, and thermal reactions after welding. Philipp A. Schmidt et al.9) researched copper and steel welding using an IR laser, and reported that copper busbars can reduce electrical resistance.
When welding experiments are performed using such IR (~1,064 nm) lasers, however, spatters, pores, and internal defects may occur, resulting in unstable mechanical and electrical properties10). To address these problems, studies on the welding process have been conducted using wavelength areas lower than IR wavelengths of late11-16). Martin Haubold et al.11) evaluated the weldability of copper using a visible light laser. Florian Kaufmann et al.12,13) conducted research on welding of copper and aluminum tabs and busbars using a green laser, and analyzed process stability, microstructure, and mechanical properties. Amirhossein Sadeghian et al.15) performed a welding experiment on copper and steel using a blue laser. They analyzed internal defects and mechanical properties after welding, and reported that continuous research is required to minimize defects.
Still, IR lasers have been commonly used in industries despite the above problems. This is because green and blue lasers still have low maximum power, and few studies have been conducted on blue lasers due to poor beam quality. Visible light lasers, such as green and blue lasers, however, can minimize defects and achieve higher welding productivity as they have a higher absorption rate for copper, which is a commonly used battery material. More research is required for green lasers to be used in industries.
During the welding process, various defects, such as spatters and internal porous structures, may occur due to high laser heat input, surface pollutants, intervals between specimens, and defocusing. They can cause such risks as fires caused by high heat input inside cells during battery production17,18). To address these problems, welding monitoring technologies have been developed of late. They can determine defective products by identifying defects and examining welding quality19,20). There are various welding process monitoring technologies, including diode-based sensors, spectral sensors, optical thermometer sensors, and camera-based vision detection. Among them, photo-diode-based sensors, which have high monitoring speed, have been commercialized and applied in many studies19).
As for battery welding in the electric vehicle industry, the welding quality of battery cans, tabs, and busbars is important. In the case of can and tab welding, the risk of fire can be reduced by improving welding quality. In the case of the dissimilar welding of cans and tabs, welding quality may deteriorate especially in the weld zone that has copper and mild steel as dissimilar materials due to the failure to form intermetallic compounds caused by low solid solubility and the brittleness caused by the segregation inside the weld zone. Thus, it is important to set the optimal laser process variables.
Therefore, in this study, a welding experiment was performed using a green laser to secure stable welding quality of electric vehicle battery cans and tabs. Nickel- coated copper and mild steel were used as materials for cans and tabs. During the laser welding experiment, the laser power condition, laser beam (beam), and scan speed were varied among the laser welding process variables. Surface and cross-section analysis was conducted to identify spatters and internal defects, and mechanical properties were analyzed by measuring shear stress and hardness.
Based on the results, the optimal laser process variables that minimize defects and have excellent mechanical properties were presented. In addition, research was conducted by applying welding monitoring technology to determine the quality of the weld zone.

2. Experimental Method and Material

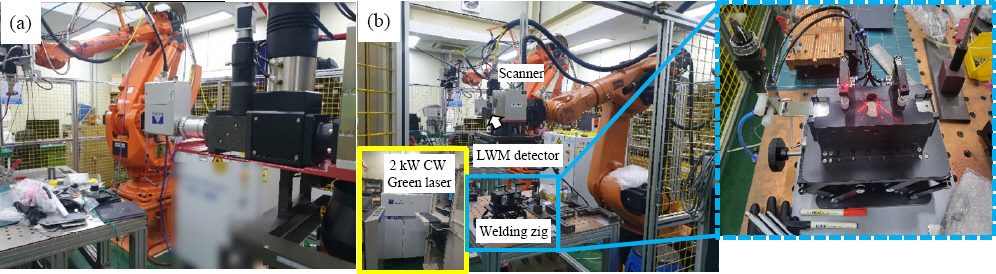
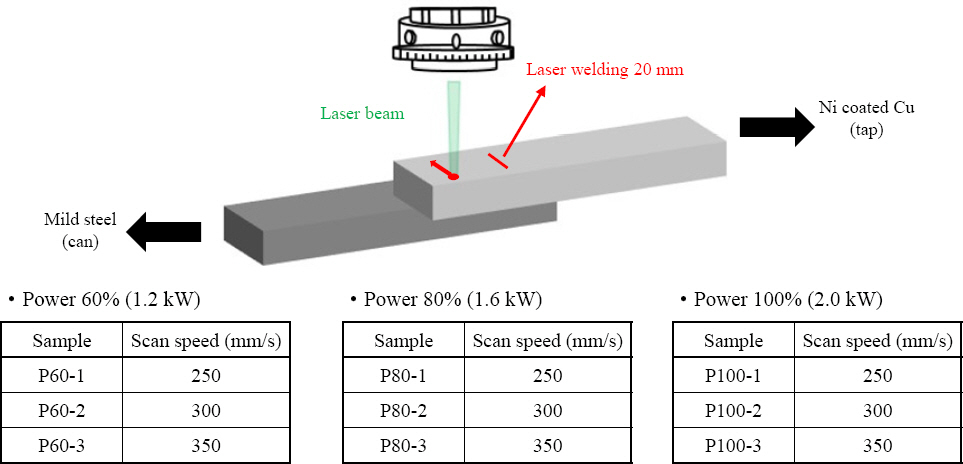
2.1 Materials and laser welding experiment conditions

The materials used in this study are nickel-coated copper and mild steel in a size of 100×30×0.5 mm. Nickel-coated copper was used as the tab material and mile steel as the can material. The chemical compositions of the materials are shown in Table 1.
Table 1
Composition of Ni coated Cu and mild steel
Elements Cu Pb Fe Sn Ni
Wt% 99.9934 0.0005 0.0043 0.0010 0.0008
Elements Fe Si Mn P C
Wt% 99.8871 0.001 0.099 0.0109 0.002
For laser welding, TRUMPF’s Trudisk 2021 continuous wave green laser with an generator wavelength of 532 nm and a maximum power of 2 kW was used. A scanner was used to move the beam with a beam size of 182 ㎛ during the process.
Fig. 1(b) shows the green laser welding system used. To minimize the gap between the specimens, a jig was fabricated as shown in Fig. 1(b).
Fig. 1
Green laser welding system images for the (a) LWM detector (b) laser welding system
jwj-42-1-106-g001.jpg
Fig. 2 shows the schematic diagram of the laser welding process between nickel-coated copper and mild steel as well as the laser welding conditions. In the laser welding experiment, the welding length was set to 20 mm while the laser power and scan speed were varied.
Fig. 2
Schematic diagram and green laser process conditions
jwj-42-1-106-g002.jpg

2.2 Microstructure and mechanical properties

After the welding experiment, HIROX’s KH-8700 optical microscope and SEC’s SNE-4500M Plus scanning electron microscope were used to examine defects in weld beads, penetration depth, and internal defects. For cross-section analysis, the specimens were cut using a low-speed cutting machine. After polishing them using a SiC sandpaper with a particle size of 200 to 4,000, they were subjected to fine polishing using 3, 1, and 0.04 ㎛ diamond and aluminum polishing solutions. The microhardness was measured three times using Struers’ Duramin-40 Vickers hardness tester while a load of 0.98 N was maintained for ten seconds, and the results were averaged. The shear stress of the specimen before and after welding was measured three times at a head speed of 1 mm/min using INSTRON’s 5982 series shear tester, and the results were averaged.

2.3 Welding monitoring

PRECITEC’s Laser Welding Monitoring 4.0, a realtime laser welding monitoring system, was used for welding monitoring as shown in Fig. 1(a). Monitoring was performed by detecting the wavelengths of plasma (ultraviolet), back reflection signal (515 nm), and temperature (infrared radiation). After acquiring the signals of 30 optimal process conditions, they were averaged to obtain reference curves. Other conditions were then detected through ten repetitions, and the quality of the weld zone was determined.

3. Experiment Results

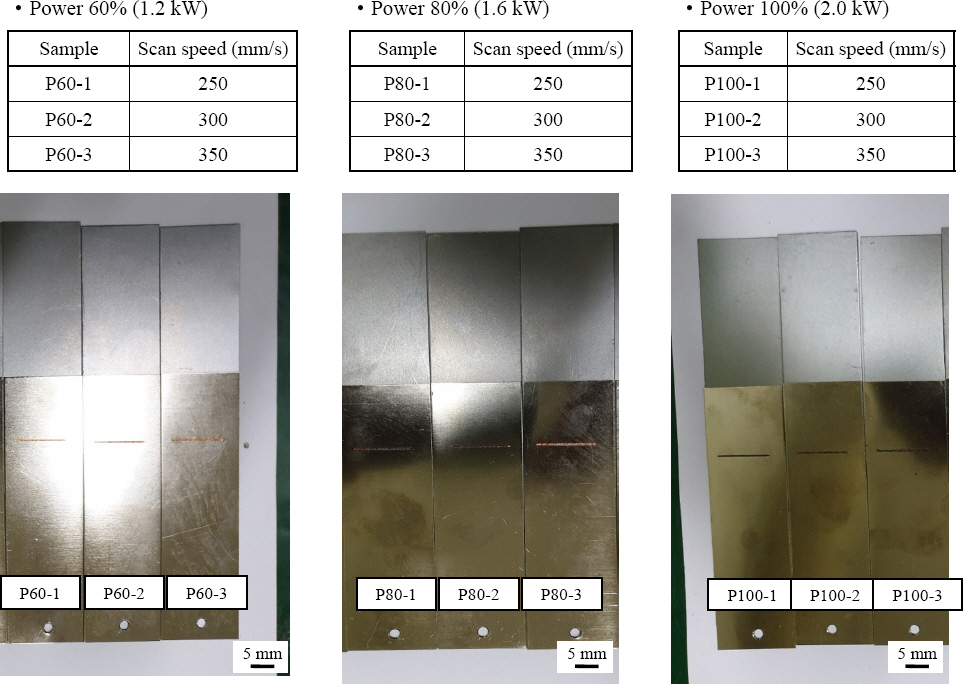
3.1 Laser welding experiment

Fig. 3 shows the heat input according to the scan speed. The heat input was calculated as follows
(1)
HeatInput(J/mm)=Laserpower(W)Scanspeed(mm/s)
The P100-1 condition exhibited the highest heat input of 80 J/cm. P100-2, P100-3, P-80-1, P80-2, P80-3, P60-1, and P60-2 showed heat input values of 66.7, 57.1, 64, 53.3, 45.7, 48, and 40 J/cm, respectively. The P60-3 condition showed the lowest value of 34.3 J/cm. The heat input tended to increase as the laser power increased and the scan speed decreased.
Fig. 3
Heat input of laser welding process
jwj-42-1-106-g003.jpg
Fig. 4 shows the welded specimens after the welding experiment. Bead images were observed using an optical microscope to identify spatters or oxides on the surface. Fig. 5 shows the surface optical microscope images after the welding experiment. Under the conditions of P60 and P80, a constant bead width could be confirmed and no spatter or crack was observed. Surface oxides, however, could be observed under the P100 conditions. A constant bead width and bead geometry were mostly identified, but spatters were observed in beads and around them under the P100-1 condition. Such spatters can degrade welding quality, adhere to parts or optical devices during laser welding, and pose a threat to workers. In addition, the P100-1 condition had the highest heat input, which resulted in spatters as severe melting increased internal steam flow and released many molten metals. Fig. 6 shows the correlation between the heat input and bead width. The increase in heat input caused by an increase in laser power and a decrease in scan speed increased the bead width because more welding metal was melted. A large bead width can obtain high heat input, but it may degrade welding quality due to the thermal effect.
Fig. 4
Green laser welding images
jwj-42-1-106-g004.jpg
Fig. 5
Top sectional optical microscope images
jwj-42-1-106-g005.jpg
Fig. 6
Correlation between heat input and bead width
jwj-42-1-106-g006.jpg
Optical microscope cross-section analysis was conducted using an optical microscope to examine defects inside the weld zone and the penetration depth as shown in Fig. 7. No internal crack or pore was found under the P80-1, P80-2, or P80-3 conditions. Internal defects, however, were observed under the P100-1, P100-2, and P100-3 conditions. A large amount of internal pores and cracks were observed under the P100-1 and P100-2 conditions. Larger pores and deeper penetration were observed as the heat input increased. The pores occurred as the internal gas could not escape because the heat was not dissipated at a high penetration depth due to the high heat input despite fast cooling in the melt pool. The cracks occurred due to the large contraction force before solidification in the cooling process. Consequently, they occurred due to the solubility problem of dissimilar metals caused by differences in physical and mechanical properties21,22). While no internal defect was found under the P60-1 condition, a small amount of pores occurred under the P60-2 and P60-3 conditions. This is because the heat input was not sufficient.
Fig. 7
Cross sectional optical microscope images
jwj-42-1-106-g007.jpg
For battery tabs, a low penetration depth may cause bonding problems. An excessive penetration depth and overheated welds may cause the risk of fire or explosion inside the battery23). Internal and surface defects also lower mechanical properties, thereby degrading welding quality. The conditions optimized considering surface and internal defects are summarized in Table 2, and they are met by the P80-1 and P80-2 conditions.
Table 2
Optimized specimen considering defect and penetration depth
P60-1 P60-2 P60-3 P80-1 P80-2 P80-3 P100-1 P100-2 P100-3
Bead defect (spatter, oxide) × × × × × ×
Penetration defect (pore, crack) × × × ×
20%<[Depth of penetration (mm)][Steel thickness (mm)]<50% × × × × × × ×

3.2 Mechanical properties

3.2.1 Shear stress

The shear stress was measured to examine the bond strength between copper and steel after the welding experiment, and the results are shown in Fig. 8. Under the P60 conditions, the shear stress decreased as the heat input decreased because the average values were 261.26, 191.40, and 40.65 MPa under the P60-1, P60-2, and P60-3 conditions, respectively. In particular, the P60-3 condition may cause bonding problems as the shear stress value sharply decreases. The P60 conditions also had poor results for bonding as they showed low shear stress values, unlike the P80 and P100 conditions. Under the P80 conditions, the shear stress also decreased as the heat input decreased because the results were 358.10, 342.50, and 330.35 MPa under the P80-1, P80-2, and P80-3 conditions, respectively. Under the P100 conditions, the shear stress decreased as the heat input increased because the values of 254.51, 283.58, and 349.53 MPa were observed under the P100-1, P100-2, and P100-3 conditions, respectively. High shear stress values were observed under the P100-1 and P100-2 conditions. Compared to the P100-3 condition, the P100-1 and P100-2 conditions led to lower shear stress values despite higher heat input. This is due to the internal defects caused by high heat input as can be seen from the cross-sectional images in Fig. 7.
Fig. 8
Shear test results of the welding specimens
jwj-42-1-106-g008.jpg

3.2.2 Microhardness

Vickers microhardness measurements were performed to examine the uniformity and non-uniformity of copper and steel in the base metals and within the penetration depth. Fig. 9 shows the microhardness results. They were measured along the horizontal and vertical directions. As shown in Fig. 9, the micro- hardness was measured within a distance of 600 ㎛ from the central penetration depth of 100 ㎛ on both left and right sides in the horizontal direction. In the vertical direction, it was measured within a distance of 50 ㎛ above and below the center of the joint. 22 and 9 microhardness indentations were performed in the horizontal and vertical directions, respectively. In the hardness results of the nickel-coated copper area, the highest result was observed in the center. The P100-1 condition led to the highest value of 357 HV, and the hardness value decreased as the heat input decreased. Under the P60-3 condition, the average hardness value of copper was found to be 65 HV for all indentations. In addition, the hardness value changed in the approximately ±200㎛ area due to the thermal effect under the P100-1, P100-2, P100-3, P80-1, P80-2, P80-3, and P60-1 conditions. The hardness changed in the approximately ±100㎛ area under the P60-2 condition, and there was no hardness change under the P60-3 condition. As for the hardness change in the mild steel area, the highest hardness value was also observed in the center. The P100-1 condition had a value of 371.3 HV, and the hardness value decreased as the heat input decreased. Under the P60-3 condition, the average mild steel hardness value was 110 HV. Due to the thermal effect, the hardness changed in the ±400㎛ area under the P80-1 condition, in the ±300㎛ area under the P100-2, P100-3, P80-1, and P80-2 conditions, and in the ±200㎛ area under the P80-3, P60-1, and P60-2 conditions. In the case of the hardness change according to the penetration depth, the hardness value was also highest in the center within the penetration depth. The highest result was observed under the P100-1 condition and the lowest result under the P60-3 condition. The results were the same as the hardness values of the copper and steel base metals.
Fig. 9
Microhardness curves of the welded penetration depth
jwj-42-1-106-g009.jpg
These hardness results could be caused by the mutual mixing of iron-copper elements. It was reported that higher hardness values are observed in the copper area because the iron fraction increases during the welding process24). In the steel area, the hardness is increased by rapid cooling during welding. M.F.R. Zwicker et al. 15,23) reported the increase in hardness due to the phase transformation of the microstructure of steel into the martensite microstructure caused by cooling. Therefore, when the heat input increased in the copper and steel welding process, more iron and copper elements were mixed and the penetration depth increased. Since more martensite was formed, microhardness increased.

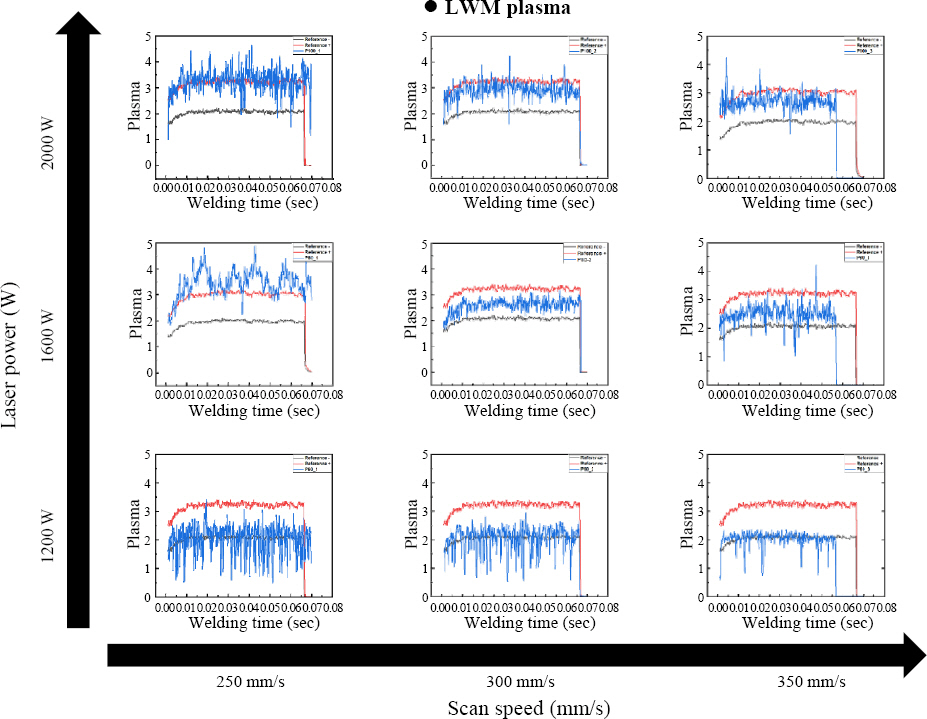
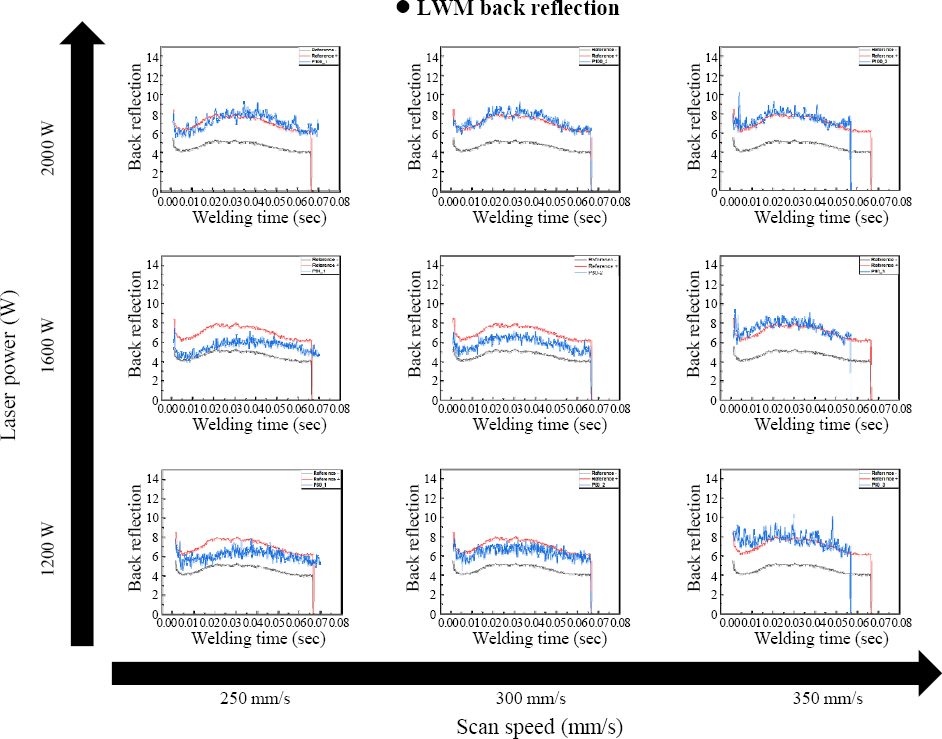
3.3 Welding monitoring

The P80-2 condition, which satisfied the optimal conditions for surface and cross-section analyzed in the welding experiment, was monitored for quality determination Prior to welding monitoring, reference curves were presented through the average values of the results of 30 specimens under the P80-2 condition. Based on the curves, the causes of defects and quality were determined. Fig. 10 shows the reference curves of the plasma signal. The same method was also applied to both the back reflection signal and temperature signal.
Fig. 10
Reference curve of plasma signal
jwj-42-1-106-g010.jpg
Fig. 11 shows the welding process plasma signals. The P80-2 condition is judged to be high quality in a stable manner considering the signals within the set reference curves. Under the P80-1 and P100 conditions, the signals outside the optimized curve area increased. This is because more plasma was generated on the surface as the heat input was higher compared to the P80-2 condition. On the other hand, the signals decreased under the P80-3 and P60 conditions. This is because less plasma occurred as the heat input was insufficient compared to the P80-2 condition.
Fig. 11
Plasma signals of laser welding process
jwj-42-1-106-g011.jpg
Fig. 12 shows the welding process temperature signals. As with plasma, the P80-2 condition is judged to be high quality in a stable manner considering the signals within the set reference curves. Under the P80-1 and P100 conditions, the temperature signals increased because the heat input was higher compared to the P80- 2 condition and the surface temperature of the material increased. Under the P80-3 and P60 conditions, the signals decreased because the heat input was insufficient compared to the P80-2 condition.
Fig. 12
Temperature signals of laser welding process
jwj-42-1-106-g012.jpg
Fig. 13 shows the welding process back reflection signals. As with plasma, the P80-2 condition is judged to be high quality in a stable manner considering the signals within the set reference curves. The back reflection signals exhibited a different tendency from the above plasma and temperature signals. It showed a tendency according to the scan speed. Its signals increased as the scan speed increased and decreased as the scan speed decreased. This is because an increase in scan speed increases the laser beam movement speed, thereby generating more back reflection.
Fig. 13
Back reflection signals of laser welding process
jwj-42-1-106-g013.jpg

4. Conclusions

In this study, a welding experiment was performed on dissimilar materials (copper and steel) using a green laser by varying the laser power and scan speed. In addition, research was conducted on welding monitoring technology. After the welding process, surface and internal defects were examined using an optical microscope, and mechanical properties were investigated. Process monitoring was performed to determine the quality of the weld zone. The results are as follows.
  • 1) Laser welding process: After the welding process, the P80 (power: 1.6 kW) condition showed no surface or internal defect while the P100 (power: 2.0 kW) condition exhibited internal pores and cracks. The P60 (power: 1.2 kW) condition also showed a small amount of pores. Among the P80 conditions, the P80-1 (scan speed: 250 mm/s) had the risk of fire due to the high penetration depth and the P80-3 (scan speed: 350 mm/s) had joining problems. Therefore, the P80-2 (scan speed: 300 mm/s) was set as the optimal condition.

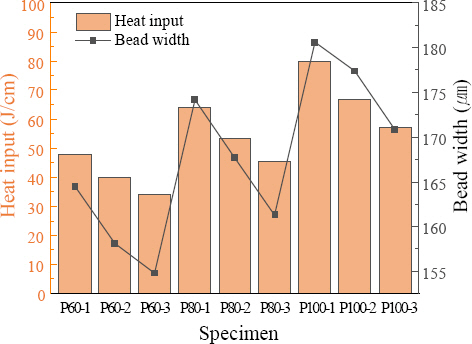
  • 2) Mechanical properties: Under the P80 (power:1.6 kW) and P60 (power:1.2 kW) conditions, the shear stress increased as the heat input increased. Under the P100 conditions, however, the shear stress tended to decrease as the heat input increased due to the internal pores and defects caused by higher heat input. Microhardness increased as the heat input increased due to the mixing of more iron and copper elements and the formation of many martensite microstructures.

  • 3) Monitoring: The P80-2 (scan speed: 300 mm/s) condition, which is the optimal condition, was set as a reference and monitored. The plasma and temperature signals increased as the heat input increased and decreased as it decreased. As for the back reflection signals, defects were found in the +error area as the scan speed increased and in the -error area as the scan speed decreased.

Since the can (copper) and tab (mild steel) welding of electric vehicle cylindrical batteries may damage the cells inside the batteries and have the risk of fire, stable welding quality is important. Therefore, in this study, welding was performed using a green laser, which has a higher absorption rate for copper than an infrared (IR) laser, to secure stable welding quality. After the welding process, the P80-2 (power: 1.6 kW and scan speed: 300 mm/s) condition, which can minimize internal and surface defects, satisfies the penetration depth condition for a low risk of fire, and has excellent mechanical properties, was presented.
To determine the quality of the green laser weld zone between the cylindrical battery can and tab, research was conducted by applying real-time welding process monitoring technology. The optimal welding process conditions were found, and it was confirmed that stable welding quality can be secured.

Acknowledgment

This work was supported by the Ministry of Trade, Industry and Energy (20014348, 20015063).

References

1. S. M. S. U. Eskander and S. Fankhauser, Reduction in greenhouse gas emissions from national climate legislation, Nat. Clim. Chang. 10(8) (2020) 750–756. http://dx.doi.org/10.1038/s41558-020-0831-z
[CROSSREF]  [PDF]
2. aS. Khalili, E. Rantanen, D. Bogdanov, and C. Breyer, Global transportation demand development with impacts on the energy demand and greenhouse gas emissions in a climate-constrained world, Energies. 12(20) (2019) 3870https://doi.org/10.3390/en12203870
[CROSSREF] 
3. P. G. Pereirinha, M. González, I. Carrilero, D. Anseán, J. Alonso, and J. C. Viera, Main Trends and Challenges in Road Transportation Electrification, Transp. Res. Procedia. 33 (2018) 235–242. https://doi.org/10.1016/j.trpro.2018.10.096
[CROSSREF] 
4. A. Das, D. Li, D. Williams, and D. Greenwood, Joining technologies for automotive battery systems manufacturing, World. Electr. Veh. J. 9(2) (2018) 22https://doi.org/10.3390/wevj9020022
[CROSSREF] 
5. M. F. R. Zwicker, M. Moghadam, W. Zhang, and C. V. Nielsen, Automotive battery pack manufacturing a review of battery to tab joining, J. Adv. Join. Process. 1 (2020) 100017https://doi.org/10.1016/j.jajp.2020.100017
[CROSSREF] 
6. Y. M. Kim, I. Hwang, and J. Cheon, Recent Research Trend of Resistance Spot Welding Quality Monitoring Technology in Korea, J. Weld. Join. 41(2) (2023) 90–99. https://doi.org/10.5781/JWJ.2023.41.2.1
[CROSSREF] 
7. M. J. Brand, P. A. Schmidt, M. F. Zaeh, and A. Jossen, Welding techniques for battery cells and resulting electrical contact resistances, J. Energy. Storage. 1(1) (2015) 7–14. http://dx.doi.org/10.1016/j.est.2015.04.001
[CROSSREF] 
8. U. F. Shaikh, A. Das, A. Barai, and I. Masters, Electro- Thermo-Mechanical Behaviours of Laser Joints for Electric Vehicle Battery Interconnects, Proceedings of Electric Vehicles International Conference (EV 2019), Bucharest, Romania. (2019) 1–6. https://doi.org/10.1109/EV.2019.8892972
[CROSSREF] 
9. P. A. Schmidt, P. Schmitz, and M. F. Zaeh, Laser beam welding of electrical contacts for the application in stationary energy storage devices, J. Laser. Appl. 28(2) (2016) 022423https://doi.org/10.2351/1.4943908
[CROSSREF] 
10. E. Punzel, F. Hugger, R. Dörringer, T. L. Dinkelbach, and A. Bürger, Comparison of different system technologies for continuous-wave laser beam welding of copper, Procedia. CIRP. 94 (2020) 587–591. https://doi.org/10.1016/j.procir.2020.09.081
[CROSSREF] 
11. M. Haubold, A. Ganser, T. Eder, and M. F. Zäh, Laser welding of copper using a high power disc laser at green wavelength, Procedia. CIRP. 74 (2018) 446–449. https://doi.org/10.1016/j.procir.2018.08.161
[CROSSREF] 
12. F. Kaufmann, A. Meier, J. Ermer, S. Roth, and M. Schmidt, Influence of defocusing in deep penetration welding of copper by using visible wavelength, Proceedings of Lasers in Manufacturing Conference,, Munich, Germany. (2021) 1434–1444.
13. F. Kaufmann, C. Forster, M. Hummel, A. Olowinsky, F. Beckmann, J. Moosmann, S. Roth, and M. Schmidt, Characterization of Vapor Capillary Geometry in Laser Beam Welding of Copper with 515 nm and 1030 nm Laser Beam Sources by Means of In Situ Synchrotron X-ray Imaging, Metals. 13(1) (2023) 135https://doi.org/10.3390/met13010135
[CROSSREF] 
14. M. Hummel, M. Külkens, C. Schöler, W. Schulz, and A. Gillner, In situ X-ray tomography investigations on laser welding of copper with 515 and 1030 nm laser beam sources, J. Manuf. Process. 67 (2021) 170–176. https://doi.org/10.1016/j.jmapro.2021.04.063
[CROSSREF] 
15. A. Sadeghian and N. Iqbal, Blue laser welding of low thickness Ni-coated copper and mild steel for electric vehicle (EV) battery manufacturing, Opt. Laser. Technol. 155 (2022) 108415https://doi.org/10.1016/j.optlastec.2022.108415
[CROSSREF] 
16. F. Kaufmann, M. Strugulea, C. Höltgen, S. Roth, and M. Schmidt, Seam Properties of Overlap Welding Strategies from Copper to Aluminum Using Green Laser Radiation for Battery Tab Connections in Electric Vehicles, Materials. 16(3) (2023) 1069https://doi.org/10.3390/ma16031069
[CROSSREF]  [PUBMED]  [PMC] 
17. Y. S. Duh, Y. Sun, X. Lin, J. Zheng, M. Wang, Y. Wang, X. Lin, X. Jiang, Z. Zheng, S. Zheng, and G. Yu, Characterization on thermal runaway of commercial 1⇊lithium-ion batteries used in electric vehicles:A review, J. Energy. Storage. 41 (2021) 102888https://doi.org/10.1016/j.est.2021.102888
[CROSSREF] 
18. Q. Wang, P. Ping, X. Zhao, G. Chu, J. Sun, and C. Chen, Thermal runaway caused fire and explosion of lithium ion battery, J. Power. Sources. 208 (2012) 210–224. http://dx.doi.org/10.1016/j.jpowsour.2012.02.038
[CROSSREF] 
19. D. Wu, P. Zhang, Z. Yu, Y. Gao, H. Zhang, H. Chen, S. Chen, and Y. Tian, Progress and perspectives of in-situ optical monitoring in laser beam welding:Sensing, characterization and modeling, J. Manuf. Process. 75 (2022) 767–791. https://doi.org/10.1016/j.jmapro.2022.01.044
[CROSSREF] 
20. C. J. Lee and J. D. Kim, A Study on Correlationship between the Induced Plasma and Emission Signals for In-process Monitoring in Stainless Steel Welding of Fiber Laser (I) Properties Changes of the Measured Signals in a Thin Plate Welding -, J. Weld. Join. 32(6) (2014) 600–605. https://doi.org/10.5781/JWJ.2014.32.6.64
[CROSSREF] 
21. M. Velu and S. Bhat, Metallurgical and mechanical examinations of steel-copper joints arc welded using bronze and nickel-base superalloy filler materials, Mater. Des. 47 (2013) 793–809. http://dx.doi.org/10.1016/j.matdes.2012.12.073
[CROSSREF] 
22. J. Li, Y. Cai, F. Yan, C. Wang, Z. Zhu, and C. Hu, Porosity and liquation cracking of dissimilar Nd:YAG laser welding of SUS304 stainless steel to T2 copper, Opt. Laser. Technol. 122 (2020) 105881https://doi.org/10.1016/j.optlastec.2019.105881
[CROSSREF] 
23. M. F. R. Zwicker, M. Moghadam, W. Zhang, and C. V. Nielsen, Automotive battery pack manufacturing a review of battery to tab joining, J. Adv. Join. Process. 1 (2020) 100017https://doi.org/10.1016/j.jajp.2020.100017
[CROSSREF] 
24. S. Dhara, M. Finuf, M. Zediker, I. Masters, A. Barai, and A. Das, Utilising blue laser over infrared laser to enhance control of penetration depth and weld strength for producing electric vehicle battery interconnects, J. Mater. Process. Technol. 317 (2023) 117989https://doi.org/10.1016/j.jmatprotec.2023.117989
[CROSSREF] 


ABOUT
BROWSE ARTICLES
ARTICLE CATEGORY 
FOR CONTRIBUTORS
Editorial Office
#304, San-Jeong Building, 23, Gukhoe-daero 66-gil, Yeongdeungpo-gu, Seoul 07237, Korea
Tel: +82-2-538-6511    Fax: +82-2-538-6510    E-mail: koweld@kwjs.or.kr                

Copyright © 2024 by The Korean Welding and Joining Society.

Developed in M2PI