1. Introduction
Following the trend of larger ships, not only the strength of steels but also their thickness are increasing, with the development and application of high-efficiency welding processes to improve productivity actively progressing.
For high-efficiency welding of high-strength thick steel plates, it is necessary to consider measures to prevent deterioration of weldability due to high heat input welding. Therefore, TMCP steel that can prevent deterioration of the heat affected zone(HAZ) by low Ceq is mainly applied, and recently, in addition to TMCP technology, oxide or nitride metallurgy technologies have been applied to secure impact toughness at coarse grained HAZ by promoting IFP(Intragranular Ferrite Plate) deformation with excellent toughness through the formation of stable oxide or nitrides at high temperature
1,2).
However, the biggest problem with TiN steel is that when the welding heat input is very high, the precipitates dissolve and lose their role near the fusion line. In order to prevent this problem, high-nitrogen TiN steel is introduced, which increases the amount of nitrogen added to about 110ppm to provide thermal stability at high temperature
3,4).
Therefore, this study aims to obtain the data necessary for the development and application of high-efficiency welding processes with excellent weld impact toughness by investigating the impact toughness of high-nitrogen TiN steel and the effect of welding processes on the microstructure.
2. Materials and Methods
2.1 Materials
The base metal used in this study was 40mm thick EH36-TM steel with a Ceq of 0.37.
Table 1 shows the tensile properties of high-nitrogen TiN steel with Ti and N added to improve the impact toughness of HAZ during high heat input welding.
Table┬Ā1
Tensile properties of base metal
|
Tensile strength (MPa) |
Yield strength (MPa) |
|
522 |
405 |
2.2 Welding process
In order to investigate the effect of heat input along with each welding process on the impact toughness of the welds of high-nitrogen TiN steel, among the high- efficiency welding processes most commonly applied in shipbuilding, welding was performed by applying the following three processes with different heat inputs : 1) double-sided multi-layer welding process using 1- electrode SAW (Single SAW: SSAW), 2) double-sided one-layer welding process using 2-electrode SAW (Tandem SAW: TSAW), and 3) 1-electrode EGW process with the highest welding heat input.
Table 2 shows the filler materials used for each welding process. In the SSAW process, a heat input of about 30KJ/cm was applied to each pass in addition to the GMAW used for sealing bead. In the TSAW process, heat inputs of about 73 and 79KJ/cm were applied to the first and second side respectively, and in the EGW process, welding was performed with the highest heat input of 264KJ/cm.
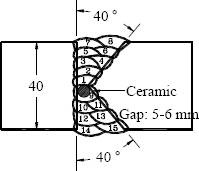
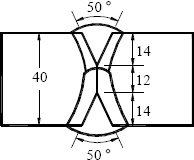
Table 3 shows detailed welding conditions and joint details for each process.
Table┬Ā2
Filler materials for each welding process
|
Title\Process |
Basicity |
AWS classification |
Dia. |
Remark |
|
SSAW |
- |
ER70S-6 |
1.2mm |
Root |
|
3.1 |
F7A6/EH-14 |
4.8mm |
Fill |
|
TSAW |
1.6 |
F7A6/EL-8 |
4.8mm |
1 Pass |
|
EGW |
- |
EG70T-2 |
1.6mm |
1 Pass |
2.3 Base metal dilution rate analysis
In order to compare the dilution ratio of the base metal to the weld metal for each process, an improvement plane was drawn on the macro section, and the dilution rate was measured through the image analysis program.
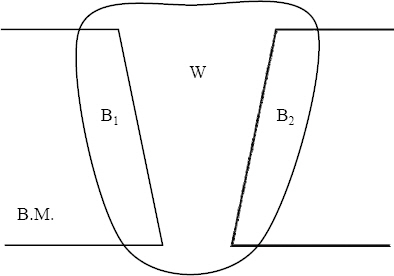
Fig. 1 shows the degree of mixing of the base metal and the filler material in the welds. Where, the dilution rate (D) of the base metal was defined as the area ratio of the fusion zone (B
1+B
2) on the base metal side to the total weld metal area (W), as shown in Equation (1)
5).
Fig.┬Ā1
Graphical representation of dilution rate
2.4 Chemical composition analysis
The chemical composition of the base metal and weld metal were analyzed using an emission spectrometer. Oxygen and nitrogen contents were analyzed using an oxygen and nitrogen analyzer (Leco, Tc-136) by mechanically manufacturing rod-shaped specimens separately.
2.5 Microstructure analysis
In order to find out the correlation between the impact toughness and microstructure of the weld metal and HAZ welded by each process, after taking the specimen from the notch position of the impact test specimen, it was etched with 5% nital, and the microstructure was observed through an optical microscope and a scanning electron microscope (Hitach, S-3200N).
2.6 Impact test
The impact test was carried out in accordance with the classification rules. The welds made by SSAW and TSAW processes were tested by making Charpy specimens with a V-notch at 2mm below the rear surface and EGW welds at 2mm below the upper surface. The impact test was performed at temperatures of -20 and -40 ┬░C, which were evaluated for the welds of EH Gr. steels during welding procedure certification tests. The notches of the test specimen were weld metal (WM), fusion line (FL), 1mm (FL+1), 3mm (FL+3), and 5mm (FL+5) from the fusion line. The average was obtained after testing in three specimens at a total of five positions
6).
2.7 Tensile test
The tensile test of the welds was conducted by manufacturing two transverse tensile test specimens, each having a thickness of 40mm and a width of 25mm, according to classification rules. The fractured area and the obtained value were evaluated by comparing them with the classification regulations and the value of the base metal.
3. Results and Discussion
3.1 Macrostructure of the welds
Fig. 2 shows the macro image of the welds made by each process, and
Fig. 3 shows the ratio of the diluted base metal to the weld metal according to each process.
Fig.┬Ā2
Macrostructures of welds obtained by each welding process
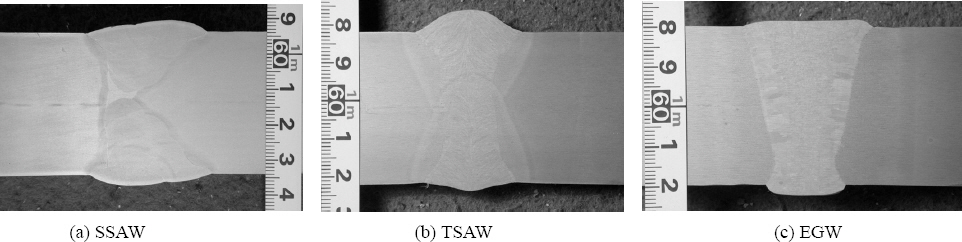
Fig.┬Ā3
Effect of welding process on the dilution of base metal
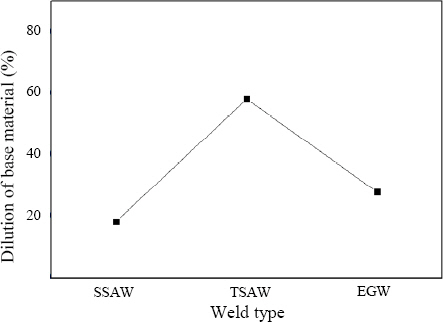
In SSAW with low heat input multi-layer welding, the dilution rate was the lowest at about 18%; in EGW, the heat input was the highest, but the dilution rate was about 28%; and in TSAW, the dilution rate was the highest at about 58%. This difference may have been due to the shape of the joint and the penetration characteristics of each process rather than the welding heat input.
3.2 Chemical composition of weld metal
Table 4 shows the chemical composition of the weld metal for each process. While the Ceq of the weld metal of SSAW and TSAW using the SAW process were almost similar at 0.40 and 0.38, slightly higher than 0.37 of the base metal, in TSAW, a relatively high content of Si, B, N, and O was detected, which was judged to have been introduced from the base metal by a high dilution rate. In particular, the content of O may have been due to the introduction of a large amount of oxidation inclusions by the low flux basicity of the applied filler material. EGW with the highest welding heat input had the highest Ceq of 0.47, which is due to a large amount of Ni and a little of Mo being added to the filler material to prevent a decrease in impact toughness during high heat input welding. In addition, O and N contents were the highest. Since the filler material used in EGW was a metal-cored wire and contained almost no slag components, most of the O and N were considered to have been introduced from the shielding gas (100% CO
2 gas) or the atmosphere.
Table┬Ā4
Chemical composition of weld metals for each welding process (wt.%)
|
Chemical composition (wt%) |
|
C |
Si |
Mn |
P |
S |
Ni |
Cr |
Mo |
Cu |
V |
Ti |
Nb |
B |
O ppm |
N ppm |
Ceq |
|
B.M |
0.11 |
0.44 |
1.43 |
0.007 |
0.004 |
0.12 |
0.02 |
0.02 |
0.14 |
0.005 |
0.01 |
0.010 |
0.0015 |
13 |
111 |
0.37 |
|
SSAW |
0.10 |
0.23 |
1.66 |
0.014 |
0.010 |
0.04 |
0.03 |
0.00 |
0.00 |
0.005 |
0.00 |
0.005 |
0.0003 |
170 |
53 |
0.40 |
|
TSAW |
0.10 |
0.43 |
1.52 |
0.016 |
0.009 |
0.09 |
0.02 |
0.02 |
0.12 |
0.005 |
0.01 |
0.009 |
0.0017 |
348 |
99 |
0.38 |
|
EGW |
0.07 |
0.25 |
1.47 |
0.017 |
0.013 |
1.91 |
0.03 |
0.10 |
0.05 |
0.005 |
0.03 |
0.010 |
0.0051 |
378 |
110 |
0.47 |
3.3 Microstructure according to welding process
Fig. 4 shows the microstructure of the weld metal according to the welding process observed through an optical microscope and a scanning electron microscope. In optical micrographs, grain boundary ferrite (GBF) was more developed in TSAW than in SSAW. In scanning electron micrographs for the intragranular microstructure, acicular ferrite (AF) was more coarse in TSAW, and a high fraction of polygonal ferrite (PF) was also observed. This may have been due to the transformation of proeutectoid ferrite promoted by the high Si and O contents of the weld metal in TSAW compared to SSAW
7), and the cooling rate was slowed down by the high heat input. On the other hand, in EGW with the highest heat input, no formation of proeutectoid ferrite was observed at the prior austenite grain boundary (PAGB) when the structure was observed through an optical microscope. When observed under a scanning electron microscope, most of them were composed of intragranular AF and PF. GBF was not created despite the highest heat input due to the effect of increasing the degree of supercooling by the addition of Ni and Mo and the inhibitory effect of GBF transformation by the high content of Ti and B
8).
Fig.┬Ā4
Effect of welding process on the microstructure of WM
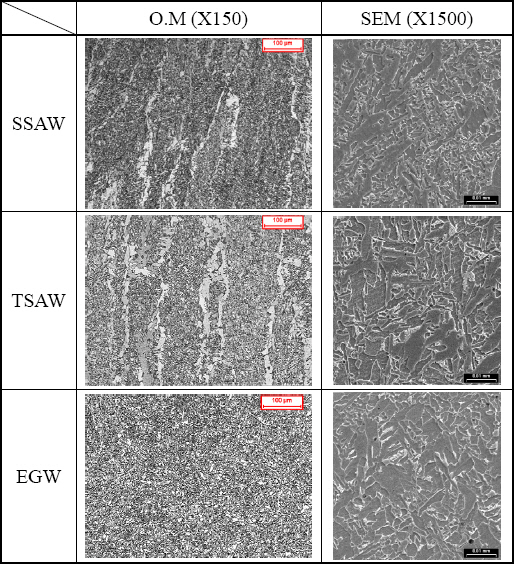
Fig. 5 shows the results of comparative observation of the microstructure of FL in the heat input of each welding process. In SSAW with the lowest heat input, GBF was hardly observed, and fine AF and PF were observed. As the heat input increased, the size of PAGB in the CGHAZ increased, with PF developing around the grain boundaries. On the other hand, even in EGW with the highest heat input, coarse GBF and ferrite side plate (FS), which were observed in conventional type TMCP steel, were not observed, with relatively fine PF and a small amount of pearlite structure. As described above, this may have been due to TiN precipitates that were stable at high temperatures suppressing austenite grain growth in HAZ with high heat input.
Fig.┬Ā5
Effect of welding process on the microstructure of FL
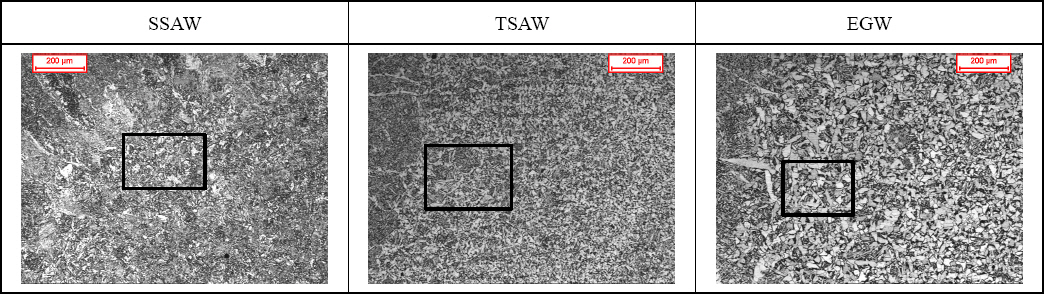
Fig. 6 shows the results of observing the microstructure of the FL+1 to FL+5 regions. In SSAW with the lowest heat input, fine AF and PF were observed at FL+1, pearlite and bainite bands mainly appearing in TiN TMCP steel were observed at FL+3, and almost the same structure as the base metal was exhibited at FL+5. With an increase in the heat input, the size of AF and PF became coarse in TSAW, but in EGW with the highest heat input, AF was hardly observed, and relatively coarsen PF and fine pearlite were observed. The microstructure of EGW was continued from FL+1 to FL+5 without a clear difference in size, with no rapid coarsening of the structure or phase change following the increase of heat input. On the other hand, the pearlite structure clustered in the form of a light band at FL+5.
Fig.┬Ā6
Effect of welding process on the microstructure of FL+1~FL+5
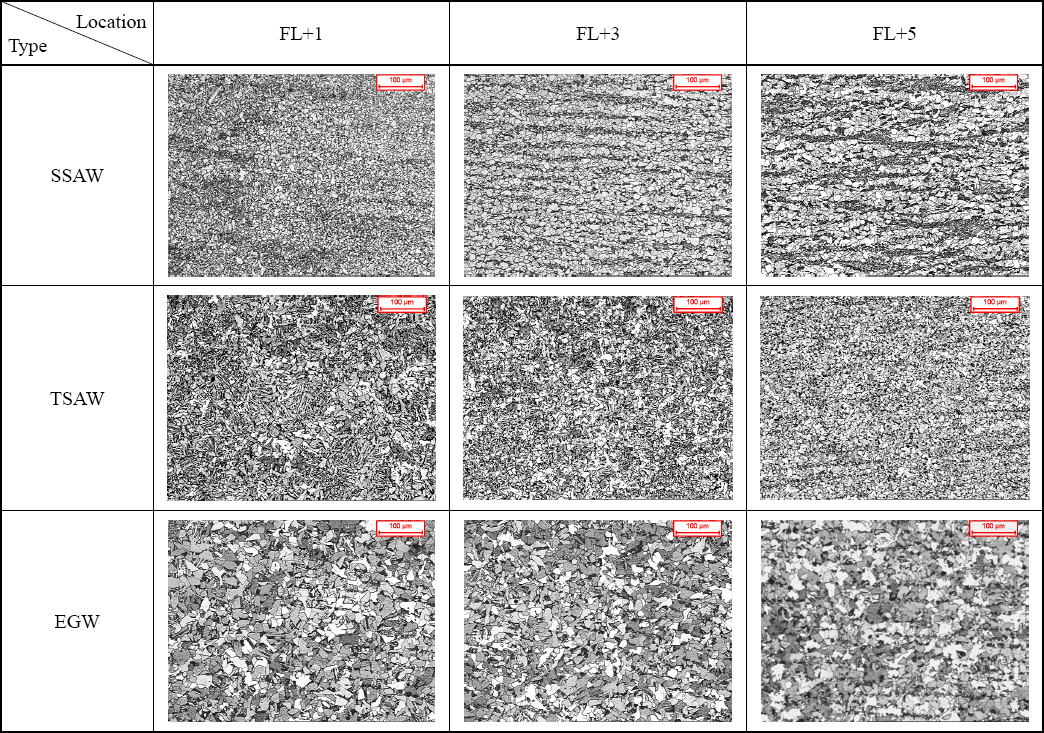
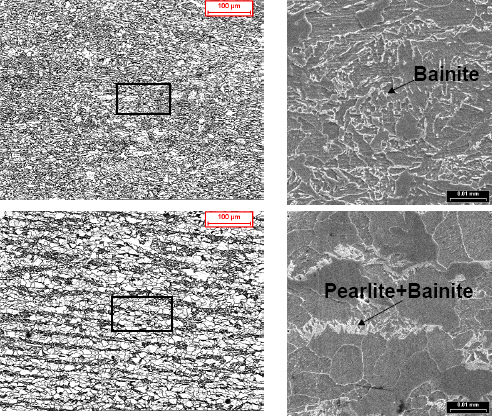
Fig. 7 shows the comparative observation of the microstructure of the base metal of the high-nitrogen TiN TMCP steel and the conventional TMCP steel through an optical microscope and SEM. In the high-nitrogen TiN TMCP steel, slightly larger ferrite with a band composed of pearlite and bainite was observed than that of conventional TMCP steel. This seemed to be because the cooling rate in the specific temperature range, between Ac3 and Ac1, during controlled rolling in the TMCP manufacturing process was lower than that of conventional TMCP
9).
Fig.┬Ā7
Comparison of microstructure of conventional type TMCP(upper) and high-nitrogen TiN TMCP steel (lower)
3.4 Effect of welding process on impact toughness
Fig. 8 shows the effect of the welding process on the impact toughness of the welds. The impact toughness of the weld metal was the highest in SSAW, with the lowest heat input. Rather, EGW with the highest heat input showed a much higher value than TSAW, which may have been due to the microstructure of the weld metal. In the TSAW weld metal, the growth of GBF was clearly observed. This GBF seemed to act as a crack propagation line during the impact test, facilitating the propagation of the crack, resulting in a rapid decrease in impact toughness. On the other hand, in EGW with the highest heat input, the formation of GBF is suppressed by Ni and alloy elements such as Mo, Ti, and B. Due to the fine AF and PF structures, the propagation of cracks was not linear, suggesting relatively high impact toughness
10). Meanwhile, the impact toughness of SSAW with GBF was the highest, as the reheated zone (RZ) formed by post-welding coexisted on the notch surface of the impact test specimen due to multi-layer welding, and the direction of growth of columnar crystals did not coincide with the direction of the notch, considerably limiting the GBF fraction at the notch. Furthermore, RZ is reported to have various impact toughnesses depending on the temperature history
11-14). Since SSAW had a relatively low heat input, the fraction of the coarsen grained RZ (CGRZ), with poor impact toughness, was low, having the effect of improving impact toughness by RZ.
Fig.┬Ā8
Effect of welding process on the impact value of welds
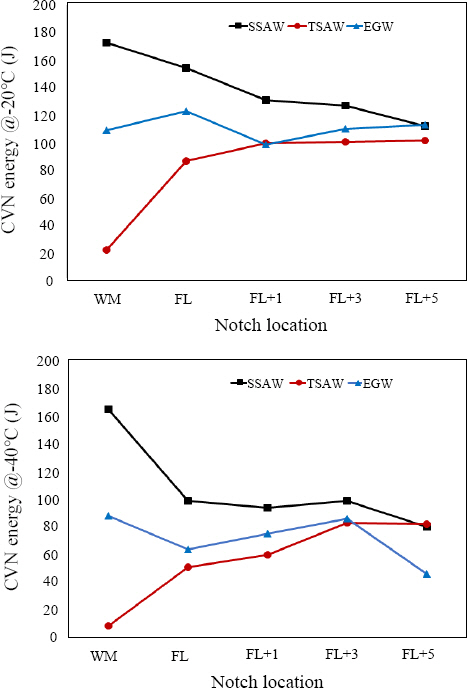
As for the impact toughness of HAZ, FL still showed the lowest impact toughness in TSAW due to the influence of weld metal; TSAW and EGW showed almost similar values after FL+1, although it was still slightly higher in SSAW with the lowest heat input. This phenomenon was also in good agreement with the HAZ microstructure observation results in
Fig. 5. It seemed to be due to the effect of suppressing PAGB growth and promoting PF generation even at a high heat input unique to high nitrogen steel, leading to insignificant differences in the shape and size of the microstructure despite the large differences in heat input.
On the other hand, the slight decrease in the FL+5 impact toughness value of EGW at -40┬░C may have been due to the fact that cracks generated around the pearlite were more easily combined and propagated during the impact test at a low temperature of -40┬░C, as pearlite and bainite, which were harder than the matrix, were clustered in a line.
3.5 Effect of welding process on the tensile properties of welds
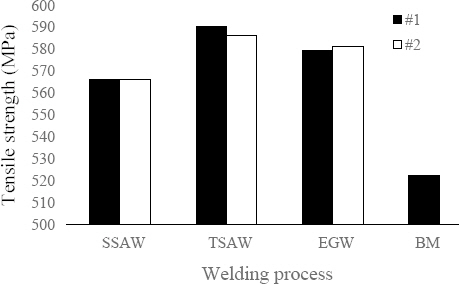
Fig. 9 shows the tensile test results of the welds compared to the base metal. As a result, base metal fracture occurred in all welding processes, including high heat input EGW, and the tensile strength at that time sufficiently exceeded the minimum standard of 490MPa required for EH36 steel and 522MPa of the base metal. On the other hand, the change in tensile strength according to the amount of heat input did not show a clear trend, which was considered to be due to the difference in plastic restraint according to the size and strength of the welds.
Fig.┬Ā9
Tensile strength of each welded joint
4. Conclusions
The following conclusions were drawn as a result of evaluating the effect of the welding process on the microstructure and impact toughness of the welds in high-nitrogen TiN EH36-TM steel using three high-efficiency welding processes mainly used in shipbuilding.
1) In the weld metal of SSAW and TSAW using the SAW process, GBF was created along the PAGB, and AF and a small amount of PF were observed in the grain. In TSAW with low basicity and high heat input, GBF was remarkably developed, and intragranular AF was more coarse. On the other hand, in the EGW weld metal, GBF was hardly generated by a large amount of alloying elements and was composed of intragranular AF and PF.
2) With an increase in the heat input, the size of PAGB in FL increased and PF developed at the grain boundary. At FL+1, the grain size of AF and PF gradually coarsened as the heat input increased, and EGW with the highest heat input showed PF and fine pearlite structures. On the other hand, FL of EGW showed a similar size and shape compared to FL+5 without grain size growth.
3) Among the three applied welding processes, SSAW and EGW weld metals well satisfied the impact values required by the classification rules for EH36 steel, but TSAW weld metal failed to meet the required impact values.
4) The HAZ of high-nitrogen TiN TMCP steel satisfied the impact value required by the classification rules without significant change, even when welding under various heat input conditions. In particular, relatively stable values were shown from FL to FL+5, even in the welds of the high heat input EGW.
5) In the range of heat input of all applied processes, the joint strength of the welds stably satisfied the standard value required for EH36 steel.


 PDF Links
 PubReader
 ePub Link
 Full text via DOI
 Download Citation
 Print
Print