1. Introduction
The shipŌĆÖs shaft transfers power from the engine to the propeller and transmits the thrust obtained from the propeller to the hull. It is responsible for maneuverability among the three features of the ship, i.e. floatability, load-carrying capacity, and maneuverabilityŌĆÖ. During the shipbuilding process, if the shaft is not aligned in a straight line or experiences significant vertical displacement, it can affect the shipŌĆÖs maneuverability through damage to the bush, frictional heating, lubrication system leakage, and excessive burden on engine, leading to financial losses due to repair and transportation delay. Therefore, these factors are closely analyzed and examined during the ship design and production processes.
In the shipbuilding process, the hull is constructed through a series of processes that involve welding, such as minor assembly, sub-block assembly, block assembly, and pre-erection (PE). These processes necessarily involve the residual stress and hull deformation caused by welding.
In particular, the deformation of the hull that surrounds the shaft during the hull assembly and welding processes should not exceed the allowable range. Since exceeding the range may result in a failure in shaft alignment, technology to predict the deformation under production loads is essentially required.
As for the shipŌĆÖs shaft system shown in
Fig. 1, the hull is completed in the PE stage before the installation of the shaft and engine in the shipbuilding stage. Even after the completion of the hull, the shaft block is continuously subjected to deformation due to the welding required for the subsequent installation of PE blocks. Deformation after block erection is confirmed by measurements and analysis. This shows that the stern block erection process is the main cause of the deformation of the shaft block. Before the insertion of the shaft into the hull, the displacement of the aft bush with respect to the center of the fore bush is an important factor that can determine the installation position of the engine. Therefore, predicting and controlling the deformation of the shaft is an essential process for the successful installation of the propulsion engine.
Fig.┬Ā1
Shaft system and deformation

For this reason, many studies have been conducted on the prediction and control of initial defects resulting from welding in steel or aluminum reinforced plate structures.
In aluminum reinforced plate structures, experimental and numerical approaches were performed to predict the initial deformation caused by welding
1), and the influence of residual stress was evaluated according to the welding method
2). Theoretical/experimental investigations were performed on thermoelastic behavior for the static/dynamic characteristics of thin plates under different boundary conditions
3), and finite element methods were developed for numerical approaches to inherent strain
4). In addition, research was conducted to determine the welding shrinkage of simplified engineering approaches to predict the interaction of structural stiffness and the final equilibrium state
5).
In the case of calculations by block unit, which involve an exponential increase in the number of finite elements and boundary conditions for analysis, however, it is not easy to apply welding deformation calculations using finite elements due to the limitations in computation time and computer performance.
As such, an FE analysis method that evaluates welding deformations using the thermal strain derived from thermoelastic analysis as the boundary condition of the weld was devised to reduce the computation time in evaluating the welding deformation of large shell structures, such as ship blocks
6). Afterwards, a method has been used to reduce the time and effort required for the analysis of the welding deformation of large structures and derive reliable results by entering the inherent strain information of the welding material into corresponding elements using a 1D truss element
7). This is an economical and effective method for predicting the overall welding deformation of large structures.
In this study, the existing thermal deformation method was used to analyze the sensitivity of input variables related to the prediction of shaft deformation that occurs during the stern block erection process for three ships (LNGC: LNG carrier, CN: container ship, and COT: crude oil tanker). Based on the results, the characteristics of the input variables were quantified, and a simplified input variable regression equation was derived.
2. Preprocessing Technique and Variables
2.1 Preprocessing technique
Prior to welding deformation analysis, the preprocessing method for the model is shown in
Fig. 2. Firstly, the necessary parts are extracted from the model for structural analysis, and the blocks are divided according to the block division diagram. 1D elements are then generated along the weld lines of the divided blocks, and necessary information is entered. The key input values are the area of the weld lines, inherent strain, and imaginary temperature
7).
Fig.┬Ā2
Modeling and analysis procedure
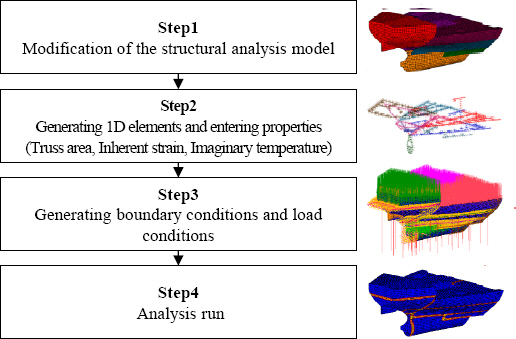
The imaginary temperature was assumed to be 1┬░C because the same welding temperature is applied to all weld lines on a typical steel plate. The welding area and inherent strain are derived through calculations that consider the type and thickness of steel plates and the distance between them. Since the information on all weld lines needs to be examined, considerable time is required. As such, empirical values presented in previous studies were used, and an welding area of 2,000 mm2 was applied to transverse 1D elements and 200 mm2 to longitudinal 1D elements. The inherent strain was used as the thermal expansion coefficient, and 0.02/┬░C was applied.
2.2 Target variables and ranges
The analysis technique used in this study is a method that implements welding shrinkage with 1D elements using a global ship model.
The key variables of this analysis technique are the cross-sectional area, imaginary temperature, and thermal expansion coefficient entered into 1D elements
6). The sensitivity of these variables was analyzed to find the optimal variable values so as to obtain the most similar analysis results to the values measured in the field. Variables that are not key variables but may potentially affect the analysis results were also added and analyzed. The variables and their respective sensitivity analysis ranges are summarized in
Table 1. Sensitivity analysis was conducted by adjusting the ratio of the existing variable values. For the analysis, the ratio of the changed variable values to the original variable values was set to be between 0.25 and 2.50, which is a relatively significant and reasonable range.
Table┬Ā1
Variable types and ranges of the parametric study
|
Variable |
VariableChanged / VariableOriginal
|
|
Cross-sectional area of longitudinal truss element |
0.25 - 0.50 - 1.00 - 1.50 - 2.00 - 2.50 unit: mm2/mm2 (VariableOriginal = 200 mm2) |
|
Cross-sectional area of transverse truss element |
0.25 - 0.50 - 1.00 - 1.50 - 2.00 - 2.50 unit: mm2/mm2 (VariableOriginal = 2,000 mm2
|
|
Imaginary temperature |
0.25 - 0.50 - 1.00 - 1.50 - 2.00 - 2.50 unit:┬░C/┬░C (VariableOriginal = 1.0┬░C) |
|
Thermal expansion coef. |
0.25 - 0.50 - 1.00 - 1.50 - 2.00 - 2.50 unit:┬░C/┬░C (VariableOriginal = -0.02/┬░C) |
|
Steel density |
0.25 - 0.50 - 1.00 - 1.50 - 2.00 - 2.50 unit: (ton/mm3)/ (ton/mm3) (VariableOriginal = 7.80├Ś10-9 ton/mm3) |
|
Support stiffness |
0.25 - 0.50 - 1.00 - 1.50 - 2.00 - 2.50 unit: N/N (VariableOriginal = 467,700 N) |
3. Sensitivity Analysis
3.1 Target of the sensitivity analysis
The sensitivity analysis conducted in this study was targeted at a finite element model for VLCC (Very Large Crude-oil Carrier) stern. This finite element model was modeled as shown in
Fig. 3 so that it could have the same nine-step erection order as the actual shipbuilding process with a block division diagram shown in
Fig. 4. The materials of the stern hull of the ship are A, AH, D, and E grade steels, which are steels for ships, but only the elastic region was considered in the analysis. Therefore, the material properties applied in the analysis are as follows:
ŌłÖ Mass Density 7.8├Ś10-9 ton/mm3
ŌłÖ YoungŌĆÖs Modulus 206,000 N/mm2
ŌłÖ PoissonŌĆÖs Ratio 0.3
Fig.┬Ā3
The welding sequence of FE model and weld lines
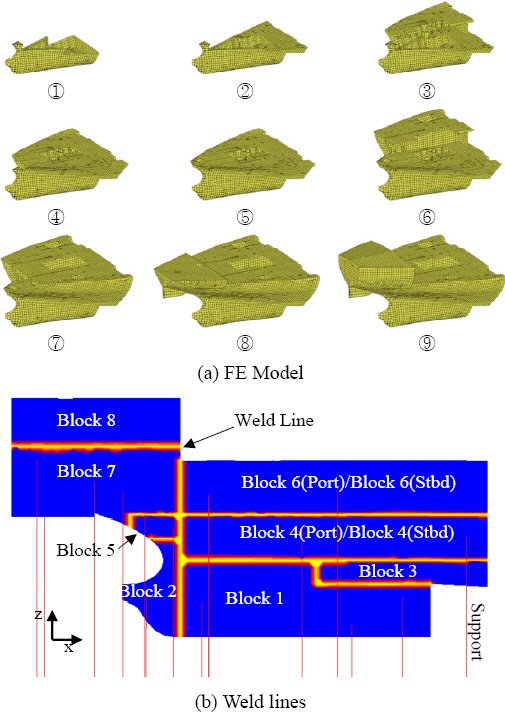
Fig.┬Ā4
Block division and erection order

The end of the stern direction shown in
Fig. 1 was selected as the observation point and its displacement in the z-direction according to the change in input variables was observed because it plays an important role in predicting the deformed shaft centerline through the distance and angle between the aft bush and the fore bush in the actual erection process and has a significant impact on determining the optimal starting point of shaft alignment. In addition, the correlation between the input variable ratio and the ratio of the z-direction maximum displacements of the aft bush was set as a sensitivity indicator to quantitatively analyze the sensitivity of each input variable.
3.2 Sensitivity analysis
For the sensitivity analysis, the welding deformation analysis was conducted using MSC Marc
8) (MSC Software Corporation, 2014). In the case of variables other than the ones subjected to the sensitivity analysis, the analysis was conducted by applying the original input values (Variable
Original in
Table 1). Based on this, the correlation between the input variable ratio and the ratio of the z-direction maximum displacements of the aft bush was set as a sensitivity indicator to quantitatively analyze the sensitivity of each input variable.
3.2.1 Comparison of sensitivity results
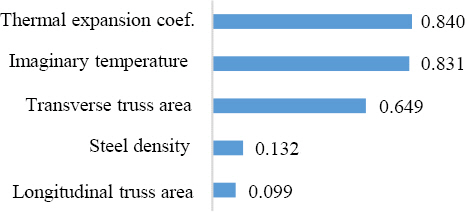
Table 2 summarizes the slopes and coefficients of determination for each variable in
Fig. 5. Since the coefficient of determination exceeded 0.95 for all variables, the linearity between the change in input values and the change in the z-direction maximum displacement within the 0.25~2.5 variable ratio range could be confirmed. It was also possible to determine which variables have a larger impact on the analysis results through the slope comparison. The sensitivity for the analysis results is shown in
Fig. 6.
Table┬Ā2
A comparison of gradients and coefficients of determination between target variables
|
Variable |
Gradient |
Coefficient of determination |
|
Longitudinal truss area |
0.099 mm2/mm2
|
0.999 |
|
Transverse truss area |
0.649 mm2/mm2
|
0.993 |
|
Steel density |
0.132 ton/mm3/ton/mm3
|
0.973 |
|
Support stiffness |
N/A |
N/A |
|
Imaginary temperature |
0.831┬░C/┬░C |
0.999 |
|
Thermal expansion coef. |
0.840 1/┬░C/1/┬░C |
0.999 |
Fig.┬Ā5
Non-dimensional results of the parametric study

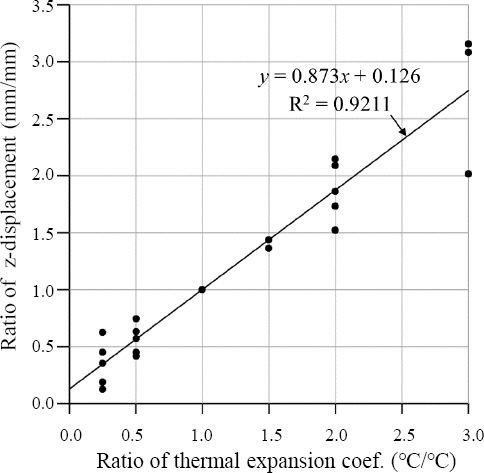
Fig.┬Ā6
In this study, an attempt was made to improve the accuracy of welding deformation prediction using an empirical method. In addition, welding deformation analysis was conducted by applying five thermal expansion coefficients (variable ratios: 0.25, 0.5, 1.5, 2, and 3) to three ships (174K LNGC, 13K CN, and Suez Max COT) to derive the correlation between the ratio of thermal expansion coefficients and the ratio of z-direction maximum displacements (maximum displacement when the input thermal expansion coefficient is used / the maximum displacement when the original thermal expansion coefficient is used). Through the welding deformation analysis results and linear regression analysis, a linear relationship with a slope of 0.873, a y-intercept of 0.126, and a coefficient of determination of 0.9211 could be derived. This relationship is shown in
Fig. 7 along with the welding deformation analysis results.
Fig.┬Ā7
An empirical formula between ratio of z-displacement and thermal expansion coef. ratio
3.2.2 Validation of the linear relationship
The most sensitive thermal expansion coefficient was modified through the sensitivity analysis to obtain results that are similar to the measured values. To verify the validity of the empirical method, the derived linear relationship was applied to the welding deformation analysis and compared with the measurement results and the results of the analysis that used the original thermal expansion coefficient.
The relationship was applied to three ships (174K LNGC, 13K CN, and SuezMax COT), and the results of the welding deformation analysis conducted using the derived thermal expansion coefficient for each ship are shown in
Fig. 8. The coefficients attached to the existing ╬▒ values were derived using the formula in
Fig. 7. Since the number of blocks that constitute the stern and the timing and frequency of deformation measurements vary depending on the ship, the erection welding stages shown in
Fig. 8 are expressed differently for each ship.
Fig.┬Ā8
A deduction process of new thermal expansion coef. and results of welding deformation analysis with the new coef.
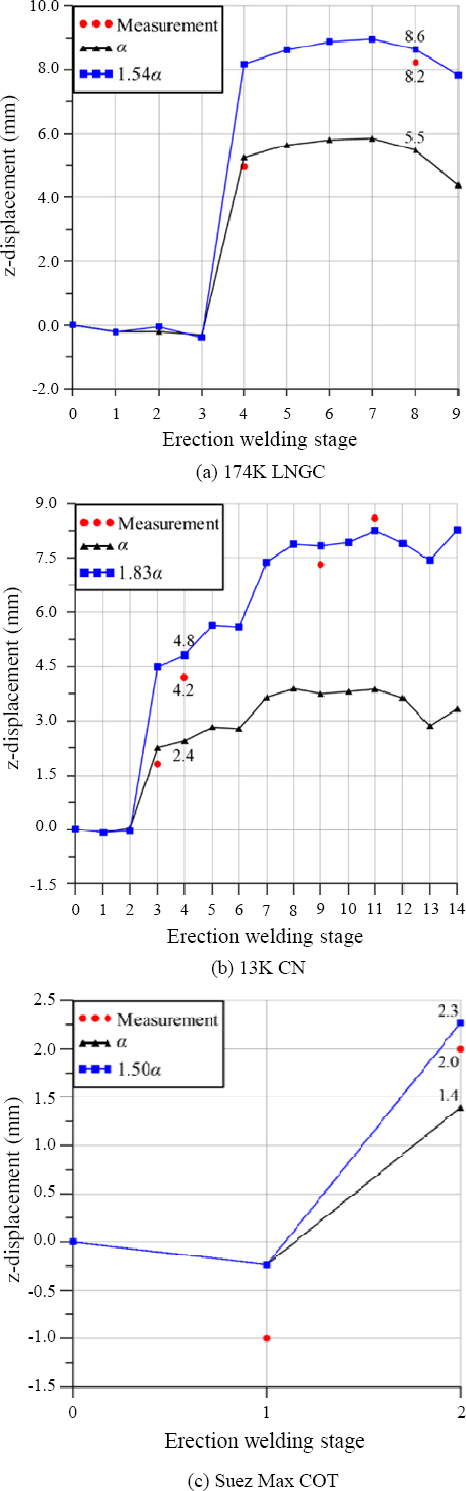
In
Fig. 8, it can be seen that the agreement between the welding deformation analysis results and the measured values for all ships improved when the new thermal expansion coefficient was applied compared to when the original thermal expansion coefficient was used. Although there was a tendency for slight overestimation, it was confirmed that the linear relationship derived through the regression analysis is effective in improving the accuracy of the analysis results.
Table 3 summarizes the error between the measured values and the analysis results when the original thermal expansion coefficient was used for each ship (Error with ╬▒ of variable ratio 1), the error when the new thermal expansion coefficient derived through the empirical method was used (Error with new ╬▒), and the improvement. Here, the improvement represents the difference between the error when the original thermal expansion coefficient is used and the error when the new coefficient is used. When the new thermal expansion coefficient was used for each ship, the error decreased by a minimum of 16.9% and a maximum of 28.2%.
Table┬Ā3
A comparison of errors: established vs. new thermal expansion coefficients
|
Type |
174K LNGC |
13K CN |
Suez Max COT |
|
Error with ╬▒ of variable ratio 1(%) |
33.4 |
42.0 |
30.3 |
|
New ╬▒ (/┬░C) |
1.54 ╬▒ |
1.83 ╬▒ |
1.50 ╬▒ |
|
Error with new ╬▒ (%) |
5.2 |
14.5 |
13.4 |
|
Improvement (%) |
28.2
|
27.5
|
16.9
|
3.2.3 Validation of the linear relationship
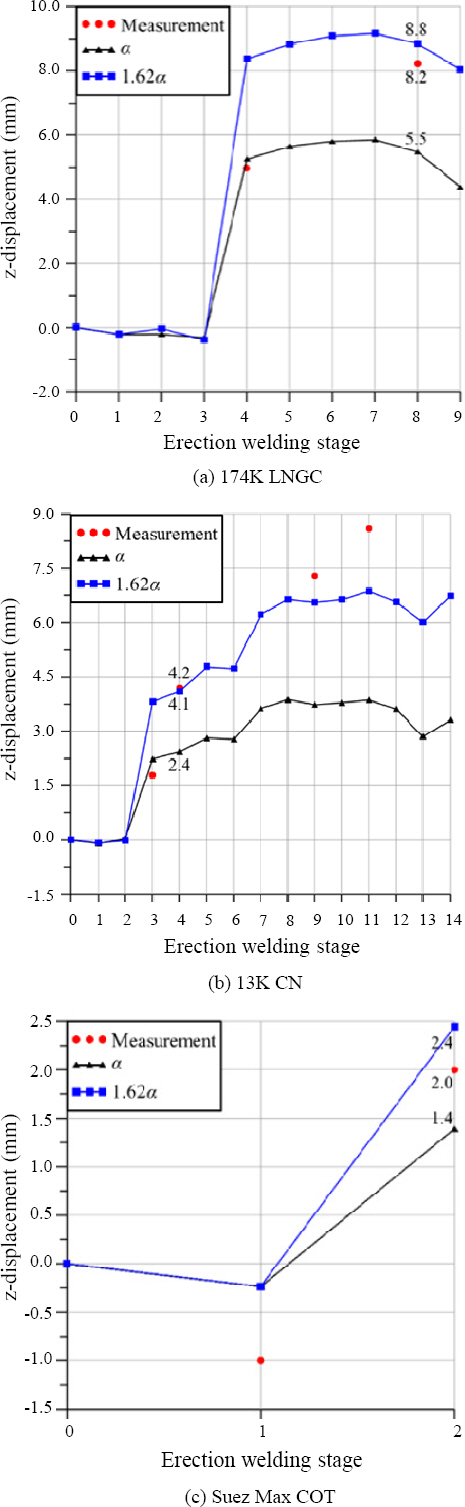
The empirical method was applied to each ship above, and it was confirmed that the use of the new thermal expansion coefficient as an input value improved the accuracy of the welding deformation analysis. Based on this result, it was deemed necessary to examine the ╬▒ value, which is the currently used thermal expansion coefficient. 1.62╬▒, which is the average of ŌĆśNew ╬▒ŌĆÖ shown in
Table 3, was selected as a new thermal expansion coefficient applicable to all ships, and it was applied to three ships (174K LNGC, 13K CN, and SuezMax COT). When 1.62╬▒ was commonly applied to the welding deformation analysis, it was found that the agreement with the measurement results increased compared to when the original ╬▒ value was used as shown in
Fig. 9 and
Table 4. This confirmed that the empirical method through the linear relationship and the newly applied thermal expansion coefficient of 1.62╬▒ had a significant effect on improving the validity of the welding deformation analysis results.
Fig.┬Ā9
A Results of welding deformation analysis with the new coef. of 1.62╬▒
Table┬Ā4
A comparison of errors: established vs. new thermal expansion coefficient 1.62╬▒
|
Type |
174K LNGC |
13K CN |
Suez Max COT |
|
Error with ╬▒ of variable ratio 1 (%) |
33.4 |
42.0 |
30.3 |
|
Error with ╬▒ of 1.62╬▒ (%) |
7.5 |
2.6 |
22.2 |
|
Improvement (%) |
25.9
|
39.4
|
8.1
|
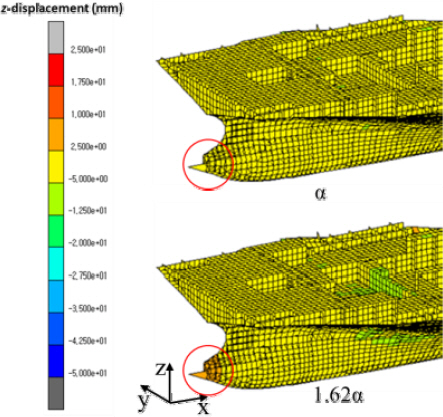
Fig. 10 compares the analysis results of 13K CN when the original thermal expansion coefficient and 1.62╬▒ were used. It can be seen that the deformation of the aft bush was significantly increased. In this study, the validity was verified by modifying only the thermal expansion coefficient among the variables, but it is necessary to optimize all the variables considering their contributions in the future.
Fig.┬Ā10
A comparison of z-displacement contour plot at 4th welding sequence
4. Conclusions
This study aimed to improve the effectiveness of the existing inherent strain-based welding deformation prediction technique during the construction of the shaft, and the following conclusions were drawn.
1) Sensitivity analysis was conducted on the input variables of the existing welding deformation prediction technique, and it was confirmed that sensitivity to the thermal expansion coefficient of the weld joint is high. Based on the welding deformation analysis results and linear regression analysis, a linear relationship between the thermal expansion coefficient of the weld joint and the z-direction maximum displacement was derived.
2) When the linear relationship was applied to the welding deformation analysis for each ship, the error between the analysis results and the measured values decreased by up to 28.2%. When a thermal expansion coefficient of 1.62╬▒ was applied to the welding deformation analysis for each ship, the error between the analysis results and the measured values decreased by up to 39.4%.
3) This study attempted to reduce the error with the measured values by modifying the most sensitive factor through sensitivity analysis. Since actual deformation is caused by interactions among multiple factors, further research is required on such interactions.


 PDF Links
 PubReader
 ePub Link
 Full text via DOI
 Download Citation
 Print
Print