A Study on Mechanical Properties of Austenitic Stainless Steel Welds Using ArcTig Welding
Article information

Abstract
With recent increase in the demand for stainless steels, the necessity of improving stainlesssteel welding output is likewise increasing. Gas tungsten arc welding (GTAW), which can obtain clean welds, is conventionally used for stainlesssteel welding. With GTAW, however, it is difficult to meet the rising demand owing to low productivity. Alternatively, ArcTig is a welding process with increased energy density through direct electrode cooling. It is thus possible to achieve highproductivity keyhole welding, which can effectively replace GTAW. However, the mechanical properties of ArcTig welds have not been properly discussed hitherto. Accordingly, these were adequately discussed in this study. Tensile, bending, hardness, and impact tests were performed to evaluate the mechanical properties of welds, with macro and micro structures also being analyzed. The test results showed that there were no internal defects in the welds, and mechanical properties were satisfied.
1. Introduction
Stainless steel is used in various fields due to its excellent physical properties and corrosion resistance. Among them, austenitic stainless steel is widely used in various fields such as bio, LNG, and hydrogen, and demand for stainless steel is increasing significantly in the LNG field. However, GTAW (Gas Tungsten Arc Welding), which has been used to obtain high-quality clean welds without slag or impurities in stainless steel, is a welding process with low productivity of 1 kg/hr1), and thus, it is difficult to cope with increasing demand.
ArcTig is a type of keyhole GTAW that allows keyhole welding by directly cooling the electrode with water and increasing energy density. For keyhole welding that penetrates the base metal, I and Y grooves are used to maintain the keyhole stably. Therefore, it is an excellent welding process that can replace the GTAW because it can reduce cost, improve productivity, and obtain high-quality welds by reducing groove processing and production time. Welding processes for keyhole welding other than ArcTig include PAW (Plasma Arc Welding), LBW (LASER Beam Welding), and EBW (Electron Beam Welding). However, in the case of PAW, many parameters need to be controlled, and hence, it is difficult for the operator to handle. Moreover, since it uses orifices and pilot arc, it is expensive to manage and maintain2). LBW is very expensive3,4) and requires expertise to handle and tolerance management is extremely difficult compared to PAW because of its small beam size. Furthermore, EBW requires the most cost and has many limitations in use because a vacuum environment is essential for welding5). On the contrary, ArcTig is easy to handle because it has current, voltage, and welding speed as parameters to be considered, similar to the existing GTAW. Moreover, there are no consumables such as orifices, unlike PAW, and thus, consumables management and maintenance costs are very low at about one-third of PAW. However, since ArcTig was developed relatively recently than other welding processes, the basis for applying ArcTig is relatively insufficient.
To this end, in this study, we performed welding and physical property tests on austenitic stainless steel materials to verify the validity of the ArcTig process before applying ArcTig to various industrial fields. After welding, macro and micro analysis alongside RT (Radiographic Test) were carried out, and hardness, tensile test, bending test, and impact tests were conducted to confirm the soundness of the welds.
2. Experimental
2.1 Experimental materials
ASTM316L plate was used as the base metal in the experiment, two plates with a size of 400 mm*150 mm*8t were welded. Since an ArcTig is a keyhole welding process, I groove without additional groove processing was used. ER 316L 1.2φ was used as a filler metal. Table 1 shows the chemical composition of the base metal and the filler metal, and Table 2 tabulates the mechanical properties of the base metal and the filler metal. The mechanical properties of the base metal represent the tensile test value obtained by collecting the test specimen in a direction perpendicular to the roll pressing direction.

Chemical composition of base and filler metal

Mechanical properties of base and filler metal
2.2 Experimental equipment
Among the welding devices used in the experiment, two 500A TIG welding machines were power-shared and a 4-roller drive type feeder capable of feeding a wire at a speed of 0-11 m/min was used as a supply module. A 4.7 kW chiller was used to cool electrodes and welding equipment, and a 6-axis robot with a payload of 6kg and repeat accuracy of ± 0.08mm was used as a welding robot and the robot welding experiment was conducted by attaching an ArcTig torch to the end of the robot arm. A 2% rare earth tungsten electrode 6.4φ was employed as the tungsten electrode. Corrosion resistance may be degraded due to depletion of chromium when oxidation is performed during welding of stainless steel, and thus oxidation of welding beads was prevented by using trailing and back purging devices to prevent the corrosion.
2.3 Experimental method
The experiment was carried out in the form of automatic welding using a robot, and TCP (Tool Center Position) was set before the experiment to smoothly operate the robot and improve precision. The welding conditions were selected through the preliminary experiment and they are tabulated in Table 3. RT was performed to check defects inside the welds before the physical properties test. The tensile test specimen was prepared in accordance with ASME Sec. IX QW-462.1 (a), the bending test specimen was prepared in accordance with ASME Sec. IX QW-462.3 (a), and the impact test specimen was prepared in accordance with ASME SA-370. The impact test specimen was manufactured as a subsize specimen with a size of 10 mm*5t*55 mm and a notch depth of 2 mm because the thickness of the base metal was less than 10 t. As for the test specimen, 1.5 mm of both sides were processed in the thickness direction, and an impact test specimen with a thickness of 5 mm was collected in the middle. Considering that Stainless 316L can be used in a cryogenic environment, a cryogenic Charpy impact test was carried out using liquid nitrogen (-196°C). To eliminate the temperature gradient inside the test specimen, the test specimen was cooled with liquid nitrogen for 10 minutes and then taken out and an impact test was performed within 5 seconds.

Experimental welding condition
For cross-sectional analysis, grinding was performed up to #2000 with sandpaper, and then polishing was performed using alumina abrasive with a particle size of 3 ㎛. For the etching for macro and micro analyses, HCl and HNO3 solutions were mixed at a ratio of 3:1 and the sample was etched with aqua regia for 10 minutes.
Hardness measurement was carried out using a Vickers hardness machine on a test specimen that was mounted, polished, and etched. The test load was set to 5 kgf and the holding time was set to 10 seconds.
3. Results and Discussion
3.1 Bead appearance and macro analysis
Fig. 1 presents photographs showing the appearance of the front and back beads after welding. Since an additional shielding device was used, oxidation of the welding bead did not progress significantly. In the center of the front bead, fine lines, which seemed to be formed when structures grown in both fusion lines met each other, were observed with the naked eye.
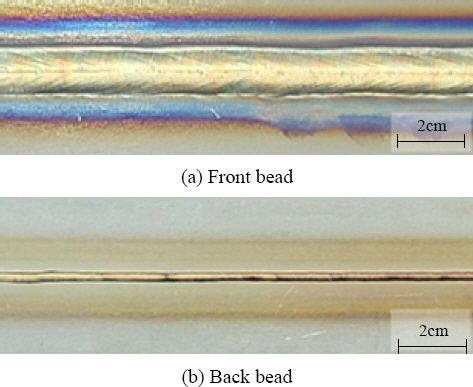
Bead appearance of ArcTig welds, (a) Front bead, (b) Back bead
RT inspection did not detect any defects in the weld and Fig. 2 shows a photograph showing the Macro cross-section of the ArcTig weld without defects. Like a typical butt weld, it was observed that the structure grows from the fusion line and ends up growing at the center of the weld. Based on the results of the cross- sectional analysis of the line of the bead center observed in Fig. 1a), the smooth formation of the bead at a depth of about 0.03 mm at the center of the bead surface appears to be the line of the bead surface. This is the part where solidification ends, and if the weld is not managed cleanly, it will be the most vulnerable part due to the segregation of impurity elements.

Macro section of ArcTig weld (Stainless 316L, 8t)
The upper part of the welding metal is widely melted and exhibits a penetration shape such as GTAW, but it has a narrow shape from the middle part and shows a penetration shape similar to the PAW weld in keyhole mode. The height of the front bead and the back bead was about 1 mm, the width of the front bead was about 12.5 mm, and that of the back bead was about 3 mm.
Because no apparent structure growth occurs around the welding metal, a heat-affected zone (HAZ) is not observed with the naked eye. Y. Feng et al. also reported that the grain size of the HAZ microstructure of K-TIG stainless steel 316L was 45.96㎛ and that of the base metal was 43.33㎛, making it difficult to confirm grain growth6). In the base metal, a band that appears to have occurred during manufacture was observed in the center of the base metal and also right next to the welding metal, indicating that the HAZ region was very small.
3.2 Microstructure analysis
The solidification modes of Austenitic stainless steel are classified into four categories. Fig. 3 presents a diagram showing the solidification mode according to the [Cr]Eq / [Ni]Eq ratio7). The equation for Cr and Ni equivalents is as follows.
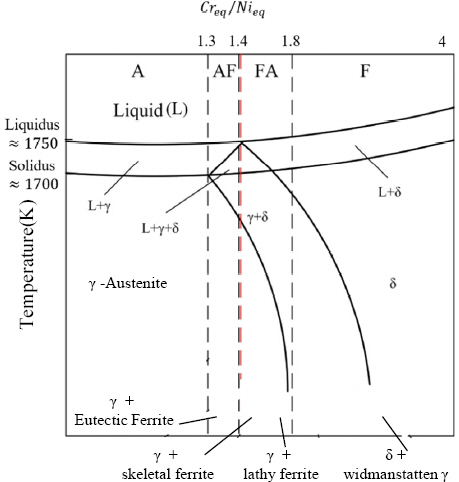
Solidification modes of austenitic stainless steels based on different Creq/Nieq
Using Equations (1) and (2), [Cr]Eq and [Ni]Eq are calculated by calculating the wt% of each element. Depending on the ratio of [Cr]Eq and [Ni]Eq, the solidification mode changes in the order of Fully Austenite (A mode), Primary γ Austenite (AF mode), and Primary δ ferrite (FA mode). Table 4 summarizes the equivalent ratio of the base metal and the filler metal calculated through Equations (1) and (2). The equivalent ratio of the base metal was about 1.70, that of the filler metal was about 1.67, and the solidification mode was expected to be FA.

Cr, Ni equivalent and equivalent ratio for base metal and filler metal
J. A. Brooks et al. summarized the ferrite morphologies of the welds in accordance with the ratio of [Cr]Eq / [Ni]Eq in austenitic stainless steel. According to this research group, it was reported that as the [Cr]Eq / [Ni]Eq ratio increased in FA mode due to micro-segregation during the solidification process, the microstructure changed from skeletal ferrite to lathy ferrite and widmanstätten austenite was formed at a higher equivalent ratio9).
Fig. 4 shows a photograph presenting the microstructure of the ArcTig weld. Fig. 4a shows the location of observed microstructures in the Macro specimen picture. Fig. 4b presents a photograph showing the microstructure on fusion lines of a weld metal and base metal. As observed in the Macro analysis, microstructure along with the band was also observed in the part of the base metal adjacent to the fusion line. It is thought that this band was formed due to the segregation of carbide during the manufacturing process of the base metal. A. F. Padilha et al. reported the formation of M23C6 carbides in austenitic stainless steel. Carbides are composed of Cr, Fe, Mo, and Ni elements and are formed at grain boundaries, and these carbides are reported to degrade ductility and toughness10). Further- more, based on the study of B. Weiss et al., the composition of M23C6 was found to be 14Mo, 63Cr, 18Fe, and 5Ni wt%11). Fig. 5 is a time-temperature-precipitation (TTP) diagram of AISI 316 stainless steel.

Microstructure in ArcTig weld, (a) Macro section, (b) Fusion line in middle of weld, (c) Grain growth direction in center of weld, (d) Grain growth direction in top of weld, (e) Fusion line in top of weld

As shown in the TTP diagram, M23C6 carbide has a very wide formation temperature range and cooling rate range, and thus, it can be formed even in the annealing process. The weld metal consists of black δ-ferrite and yellow γ-austenite, and columnar and columnar dendrite structures grown from the fusion line were observed near the fusion line. Fig. 4c shows a photograph of the center of the weld metal, where the structure grown from both fusion lines and the structure grown from the center meet. Mainly vermicular (skeletal) ferrite was observed, and lathy ferrite was also observed in some regions. The center of the weld is where segregation of low melting point inclusion, which cause high-temperature cracks, occurs the most, but no cracks were found in this experiment. Fig. 4d is a photograph showing the microstructure at the upper part of the weld metal. The structure that has grown upward from the fusion line and the structure that has grown around the upper fusion line meet to form a solidification grain boundary. In general, epitaxial grain growth occurs in which microstructures grow to the top along the orientation of the previous structure when the weld metal solidifies; however, in this experiment, microstructures seem to have grown separately at the upper part. The cause of this phenomenon was considered in Fig. 2. As shown in Fig. 2, there is a difference between the left penetration and the right penetration shape of the weld metal. From the difference in penetration forms, it can be seen that less heat input was put into the right side than on the left side of the weld. The fast cooling rate caused by the low heat input increased the nucleation rate in the upper right side of the weld metal, and grains in a new orientation seem to have grown. On the contrary, a cooling rate is relatively slow in the upper left part of the weld metal, which seems to have more heat input, and hence, it is connected to the upper part of the weld metal along the orientation of the structure grown from the fusion line. Fig. 4e is a photograph showing the fusion line of the upper part of the welding metal. Like other parts of the weld metal, vermicular and lathy ferrite seen in FA solidification mode was observed. Furthermore, more dendrite structures were observed than columnar compared to Fig. 4b. This is thought to be due to the aforementioned low heat input.
3.3 Hardness test
Fig. 6 shows the hardness distribution of the ArcTig weld. As shown in the graph, the hardness at the center in the thickness direction of the weld has an average value of about 160 Hv in the weld metal, and the base metal has a higher hardness value of about 171 Hv. The microstructure was observed in Macro and Micro analyses, which is thought to have higher hardness than the weld.

Hardness distribution in ArcTig weld
In contrast, the hardness distribution in the upper part of the weld in the thickness direction shows a different pattern. The hardness of the weld metal is about 164 Hv on average, and that of the base metal is about 165 Hv, and they show almost the same hardness distributions. The cause of these results is shown in Fig. 7. Fig. 7 presents the fusion line at the upper part in the thickness direction of the weld. In this figure, the upper part represents the surface of the weld, and the lower part represents the center of the weld. The base metal used in this experiment is subjected to annealing and pickling processes after hot roll pressing. As shown in the picture, a relatively coarse isotropic structure formed through a recovery-recrystallization-growth process that occurs during the annealing process was observed on the surface of the base material. However, at the center of the base metal, a fine structure appears in which grain growth is suppressed by carbides. Therefore, in the hardness distribution graph of Fig. 6, the hardness at the center of the weld has a higher hardness distribution in the base metal reinforced by grain refinement than in the weld metal, whereas the hardness on the surface of the weld metal shows a similar hardness distribution compared with that of the annealed heattreated base metal. Therefore, when HRB 80.7, which is the hardness value of the base metal shown in Table 2, is represented as Vickers hardness, it is about 158 Hv, which is at a level similar to the hardness value measured in this study, meaning that the hardness of the base metal hardly decreased due to welding.
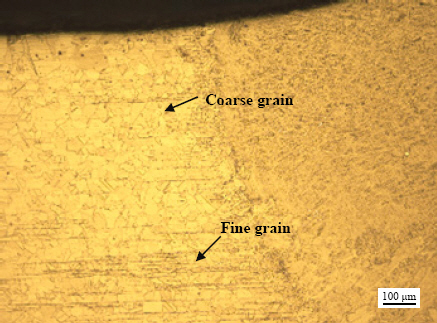
Grain size difference of base metal near fusion line
3.4 Tensile test and bending test
Table 5 shows the tensile test results of the ArcTig weld, and Fig. 8 shows a photograph of the tensile test specimen after the tensile test. The average of four tensile strength test results was 581.9 MPa, and the elongation was about 41.1%. Three of the four specimens were fractured in the base metal, and one specimen was fractured in the weld. This is almost the same level as the tensile strength of the base material shown in Table 2. Since ArcTig is a keyhole process, the proportion of the base metal among welding metals accounts for 90% or more even when a filler metal is used. Therefore, it appears at a level almost similar to the tensile strength of the base metal. However, the elongation was reduced by about 16%. This is due to the difference between the tensile test direction and the roll pressing test direction, and when the tensile test is conducted in the longitudinal direction of carbide, the elongation seems to be low because the carbide lacks ductility. On the contrary, the elongation rate of the base material indicated in Table 2 was less affected because the tensile test direction and the carbide direction elongated by roll pressing were perpendicular to each other as the tensile test was conducted in a direction perpendicular to the rolling direction.

Tensile properties of ArcTig specimens
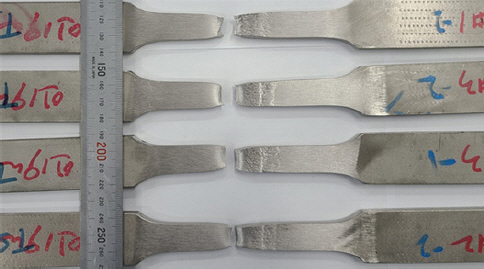
Tensile test specimens
Fig. 9 shows a specimen photograph of a bending test. a and b are top and side photographs of the face bending specimen, respectively, and c and d are top and side photographs of the specimen subjected to root bending, respectively. As shown in the figure, no cracks were found in the front and back sides after the bending test, indicating that the weld has sufficiently good ductility.

Bending test specimens, (a) face bending top view, (b) face bending side view, (c) root bending top view, (d) root bending side view
3.5 Impact test
Table 6 presents the results of the cryogenic Charpy impact test using liquid nitrogen. The impact test measured and compared the impact absorption energy at two positions, namely the welding metal and the heat-affected zone. Since there was no clear heat-affected zone in the collection position of the heat-affected impact test specimen, a notch was set at a distance of 1-2 mm from the fusion line, and the collection was carried out. The average impact absorption energy of the weld metal was 99.44J, and that of the heat-affected zone was 74.40J, suggesting the cryogenic toughness of the weld metal was better. Fig. 10 is a photograph of a test specimen of welding metal and a heat-affected zone after conducting an impact test. Figs. 10a and 10b are top and side photographs of the weld metal impact test specimen, respectively, and Figs. 10c and d are top and side photographs of the heat-affected zone test specimen, respectively. The heat-affected zone test specimen was completely ruptured into two pieces, the weld metal test specimen was not broken and a part of it was still attached. In addition, it was consistent with the test results in that the amount of plastic deformation of the heat-affected zone test specimen was smaller than that of the weld metal test specimen.
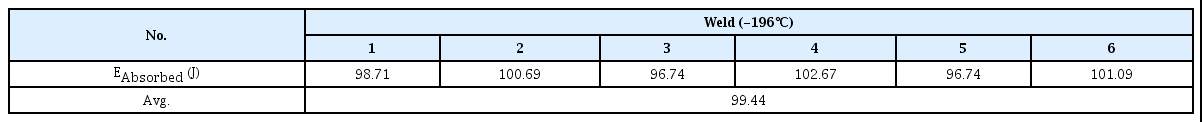
Cryogenic charpy impact test results
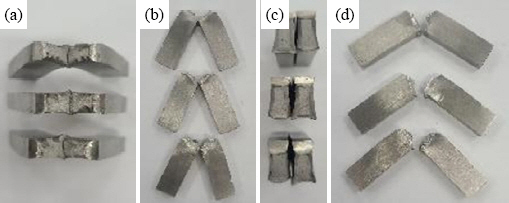
Charpy impact test specimens, (a) Weld specimens top view, (b) Weld specimens side view, (c) HAZ specimens top view, (d) HAZ specimens side view

In general, the cause of the degradation in the toughness of HAZ in arc welding is known as structure coarsening. However, in the ArcTig of this experiment, structure coarsening rarely occurred. As a result, HAZ has low impact absorption energy because of the carbide segregation at the center of the base metal mentioned above, and it can be interpreted that the weld metal was completely melted and carbide was removed, the ductility was restored, while carbide was still left in the heat-affected zone. Fig. 11 is a photograph of the fracture surface of the heat-affected zone specimen after the impact test. Fig. 11a is the ruptured surface of the impact specimen of HAZ, and the part of the photograph that involves plastic deformation and ductile destruction is the part of both surfaces that have been recrystallized and grown by annealing. In contrast, the cleavage fracture, in which brittleness destruction occurred with little plastic deformation, can be seen at the center where grain growth was suppressed by carbides. On the contrary, Fig. 11b shows the ruptured surface of the impact specimen of the weld metal, and it is possible to observe the shape of a ductile ruptured surface that forms a fine dimple even at the center. In general, it is known that the finer the grain, the better the physical properties such as strength, toughness, and ductility. However, in this experiment, even though fine grains were formed, brittleness destruction occurred in the center of the HAZ, which suggests that the formation of vulnerable carbides at the center of the base metal affected the degradation of toughness. However, since the formation of carbides in the base metal does not cause serious problems in quality, manufacturers seem to have made it in consideration of economic feasibility and productivity. ArcTig is a process that uses high current and high heat input conditions compared to general TIG welding to form a keyhole, but as the results of this research, the weld has good physical properties. In 2004, Chang et al. stated that the research on stainless steel welding technology using keyhole GTAW provided good thermal efficiency, resulting in a decrease in total heat input and deformation compared to other processes12). The same can be applied to ArcTig, which is expressed in a schematic diagram in Fig. 12. Fig. 12 qualitatively represents the phenomenon that occurs during ArcTig welding. As illustrated in the figure, plasma formed by high current forms a keyhole and is emitted in the form of tail and exit plasma, respectively13). In other words, it can be interpreted that the physical properties of the weld are good even though it is a high current since all of the plasma of the high current is not put into the weld and is discharged after forming the weld. In this experiment, it was considered from the viewpoint of the mechanical characteristics of the ArcTig weld. However, the corrosion resistance of stainless steel may degrade due to sensitization caused by welding, and thus, we plan to carry out an experiment on electrochemical properties including corrosion properties in future research.
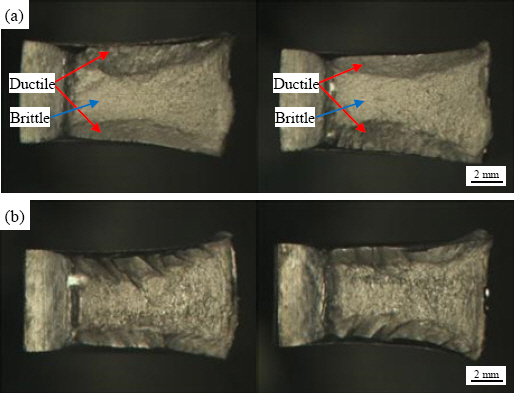
Charpy impact test fracture surface, (a) HAZ, (b) Weld
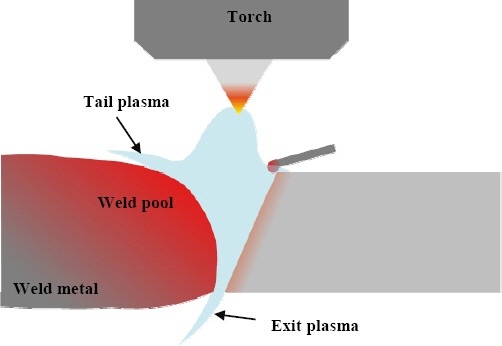
Plasma flow in ArcTig welding
4. Conclusions
The results of the ArcTig welding experiment on 316L stainless steel resulted in the following conclusions.
1) The ArcTig weld of 316 L stainless steel 8t has a front bead width of about 12.5 mm, a back bead width of about 3 mm, and a bead height of about 1 mm on both sides, forming a sound weld without defects.
2) The microstructure of the weld metal consisted of γ- austenite and δ-ferrite, and vermicular and lathy ferrite observed in FA solidification mode was observed.
3) On the upper part of the weld metal, new grain growth in the transverse direction was observed instead of the epitaxial grain growth which is a general solidification pattern of a weld. This is due to a local difference in heat input, and it seems to be caused by nucleation attributed to low heat input.
4) The properties of the ArcTig weld satisfied appropriate values, and no cracks were found in the bending test, verifying the integrity of the weld once again.
5) The difference in the physical properties of the weld and the base metal seems to be due to the carbide formed during the manufacturing process of the base metal, and the toughness of the weld seems to be improved as the carbide is removed by welding.
6) Since this experiment only dealt with mechanical properties, an experiment on corrosion properties will be conducted in future research.