대입열 용접부의 구조적 건전성에 미치는 결함의 영향
Effect of Defects on Structural Integrity in High-Heat-Input Weldment
Article information

Abstract
With the rapid increase in the size of container ships, the steel plates used for ship hulls have increased in thickness. The use of thick plates leads to an increase in welding. Alternative welding processes such as electro gas welding (EGW), with high heat input have been replacing the multi-pass flux cored arc welding process. Shipbuilding companies have tended to use EGW increasingly to improve productivity. However, because the toughness of steel tends to decrease for thicker plates, brittle fracture requireded more attention.
Although some research on high-heat-input EGW weld joints has been performed, much less attention has been paid to estimating the integrity of defective high-heat-input weld joints. The purpose of this study was to determine the reliability of EGW weld joints for thick plates. To do so, the fracture toughness of EGW weld joints was investigated. In addition, to estimate the integrity of defective welds, the fatigue characteristics of experimentally reproduced defective welds were examined. Based on these investigations, an engineering critical assessmentwas conducted. As a result, a standard for the allowable defect size for field application according to the defect type is proposed.
1. 서 론
최근 조선산업에서는 선박의 수송효율 극대화를 위해 컨테이너선이 대형화되고 있으며, 이에 따라 고강도 극 후판 강재의 적용이 증대되고 있다. 이러한 극후판 강 재의 적용에 따른 용접 생산성 저하를 해결하기 위해 기존의 FCAW 대신 대입열 용접 공법인 EGW가 확대 적용되고 있다. EGW 공법은 FCAW 대비 용접생산성을 획기적으로 향상시킬 수 있으나, 고강도 극후판 강재의 사용 및 EGW와 같은 대입열 용접법 적용에 따른 피로수명 및 파괴인성 저하 등이 우려되고 있다. 용접부의 피로수명, 파괴인성에는 용접부 자체의 기계적 성질, 화학조성, 미세조직, 잔류응력 등 다양한 인자들이 영향을 미친다. 이러한 다양한 인자 중 본 연구에서 는 기공, LF와 같은 용접부에 발생할 수 있는 다양한 형태의 결함들이 용접부의 피로수명 및 파괴인성에 미 치는 영향을 평가하고, 실제 용접부에 허용 가능한 결함의 수준을 평가하고자 하였다. 이를 위해 EGW 공법 을 적용한 극후판 용접부에 대하여 파괴인성 평가를 바탕 으로 구조물 건전성 평가(ECA: Engineering Critical Assessment)를 실시함으로써 결함이 존재하는 경우 구조물의 수명에 미치는 영향을 평가하였다. 또한, EGW 공법에 발생할 수 있는 결함을 인위적으로 재현하여 피 로시험을 수행함으로써 IIW(International Institute of Welding)에서 제시하고 있는 피로설계곡선과 비교 하였으며, 최종적으로 ECA 결과와의 비교를 통하여 현업에서 활용할 수 있는 결함 유형별 허용크기 기준을 제시하고자 하였다.
2. 본 론
2.1 모재평가
본 연구에 사용된 강재는 ASTM A131 EH40 (Thick- ness: 70mm)으로 TMCP(Thermo Mechanical Control Process) 공법으로 제조되었으며, 화학성분은 Table 1 과 같다. 기계적 물성을 평가하기 위하여 인장시험편과 충격시험편을 강재 두께의 1/4T에서 강재의 압연방향 으로 제작하였으며, 인장시험은 2개 시험편에 대한 평 균값을, 충격시험은 3개 평균값을 평가하여 Table 2에 나타내었다. 강재 평가 결과 화학성분과 기계적 물성은 강재 규격에서 요구하는 기준을 충분히 만족하는 수준으로 확인되었다1).

Chemical composition of base metal (wt.%)

Mechanical properties of base metal
3% Nital을 이용하여 에칭(Etching) 후 미세조직을 관찰한 결과는 Fig. 1과 같다. 표면부와 중심부는 인성 이 매우 높은 조직으로 알려진 베이나이트(Bainite) 및 미세한 페라이트(Ferrite)가 혼재된 조직을 나타내고 있으며, 중심부에서는 개재물이 일부 관찰되었으나, 대체로 양호한 조직 분포를 나타내었다.

Microstructure of base metal (a) surface, (b) center
2.2 용접부 평가
2.2.1 시험편 제작
컨테이너선에 사용되고 있는 EH40강의 대입열 용접 부에 대한 평가를 위하여 EGW 공법을 적용하였으며, 용접 조건은 Table 3에 나타낸 바와 같이 개선각 20˚, Root 간격은 14 mm를 적용하여 현업에서 적용할 수 있는 EGW 공법의 최대 입열량을 재현하고자 하였다.

Welding condition
2.2.2 용접부 인장시험
용접부 인장시험은 ASTM E8의 시험 규격을 적용 하였으며, 그 결과는 Table 4와 같다. 용접부에 대하 여 모재 대비 높은 인장강도를 요구하는 AWS D 1.1 를 잘 만족하고 있으며, 모재에 비해 인장강도(T.S)와 항복강도(Y.P)가 높고 연신율(Elongation)은 낮은 일반적인 경향을 나타내고 있다2,3).

Tensile test results of weldment
2.2.3 용접부 경도시험
경도시험은 ASTM E97 시험 규격을 적용하였으며, Face, Middle, Root 위치에서 용접부는 2 mm, Fusion line 부터는 1 mm 간격으로 측정하여 그 결과를 Fig. 2 에 나타내었다. 열영향부(HAZ: Heat Affected Zone) 의 경도 값은 용접금속(Weld Metal)과 모재보다 낮은 경향을 나타내고 있는데, 이는 Fig. 3과 같이 높은 입열량으로 인하여 냉각속도가 느려짐에 따라 모재의 베 이나이트(Bainite) 및 미세한 페라이트(Ferrite)가 조대 한 입계페라이트(Grain boundary ferrite) 및 다각형 페라이트(Polygonal ferrite)와 같은 연질조직으로 변화되어 경도가 감소된 것으로 판단된다4,5).
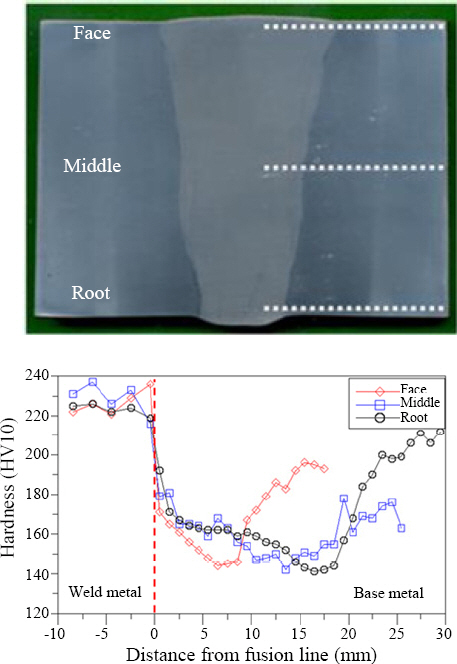
Vickers hardness of weldment

Microstructure of coarse grain heat affected zone (a) surface, (b) center, (c) root
2.2.4 용접부 파괴인성 시험
파괴인성시험은 BS 7448 시험규격을 적용하였으며, 용접금속(WM: Weld Metal)과 결정립 조대화 영역 (CGHAZ: Coarse Grain Heat Affected Zone)에 대하여 실시하였다. 시험편은 3-point bending type 으로 제작하였으며, Local compression method를 이용하여 Residual stress를 재분포 함으로서 시험편에 유효성이 있는 피로균열을 생성시켰다. API RP 2Z에 따르면 CGHAZ의 CTOD 값에 대한 유효성 판단 시 시 험편 두께 75 % 범위 내에서 CGHAZ 분율 15 % 이상 포함하여야 하며, 입열량 3.0kJ/mm와 4.5kJ/mm 에서는 FL에서 0.5mm 이내에 예비피로균열이 생성되 었을 때의 CTOD 값을 유효한 값으로 판단한다6). 본 연구에서의 입열량은 약 60kJ/mm 수준으로 API RP 2Z에서 요구하고 있는 입열량과 차이는 있으나, FL에 서 0.5mm 이내에 예비피로균열이 존재하는 경우의 결과를 정리하였다.
CTOD(Crack Tip Opening Displacement)의 계 산은 BS 7448에서 제시한 식 (1)을 이용하였으며, 그 계산결과를 Table 5에 나타내었다7). WM은 0.13mm ~ 0.23mm, CGHAZ는 0.08mm ~ 0.54mm 수준으로 WM 대비 CGHAZ 결과가 저하되는 결과를 나타 내었다. CTOD 값이 저하되는 원인으로 균열 선단에 M-A(Martensite-Austenite)가 많이 분포하는 경우 M-A가 균열 시작원으로 작용하여 파괴인성 값이 저하 되는 연구결과가 보고되고 있는데, 본 연구의 EGW 공 법을 적용한 결과에서도 FL과 근접한 CGHAZ 영역이 M-A가 발생될 수 있는 온도 영역에서 장시간 노출되어 CTOD 값이 저하된 것으로 추정된다8).

Test results of CTOD (test temperature: -10°C, units: mm)
K = Stress intensity factor, Vp = Plastic com- ponent of notch-opening displacement, a = Crack length
2.3 피로시험
2.3.1 시험편 제작 및 시험조건
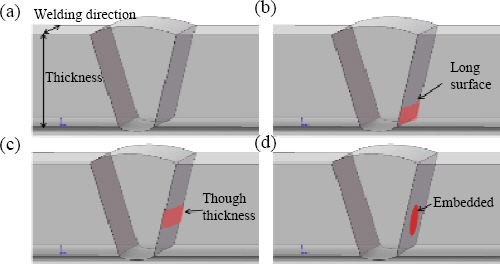
용접부에 대한 피로 선도 기준은 용접에 의한 각 변형 (Angular distortion)과 여성(Reinforcement), 용접 방법(Process), 구조물 형상, 재료의 종류(Material), 두께(Thickness), 표면 조도(Roughness), 외부 환경 (Corrosive environment), 온도(Temperature), 용접 후처리(Welding post-treatment) 등에 따라 피로 선도 기준을 달리 적용하고 있다8,9). 본 연구에서는 EGW 공법에서 발생될 수 있는 결함을 Table 6에서와 같이 용접부 표면에 존재하는 연속적인 결함인 Long surface type, 용접부 내부의 연속적인 결함인 Through thickness type, 그리고 용접부 내부에 존재하는 비연 속적인 결함인 Embedded type으로 구분하여 시험편을 제작함으로서 EGW 용접 중에 발생할 수 있는 결함이 피로특성에 미치는 영향에 대해 평가를 수행하였다.

Defect type
실제 용접부에서 발생할 수 있는 결함을 재현하기 위하여 Fig. 4와 같이 기계가공으로 홈(Notch radius: 0.1mm)을 만든 후 가공된 홈에 세라믹을 삽입함으로서 미용착부가 생성되도록 용접을 실시하여 Fig. 5와 같이 결함을 형성시킨 후 Fig. 6의 형상으로 시험편을 제작하였다. 시험편 제작 시 Through thickness defect 와 Embedded defect의 경우 용접 Toe부에서 발생되 는 응력집중효과를 배제하기 위하여 Face와 Root의 여 성(Reinforcement)을 완전 제거하였다.
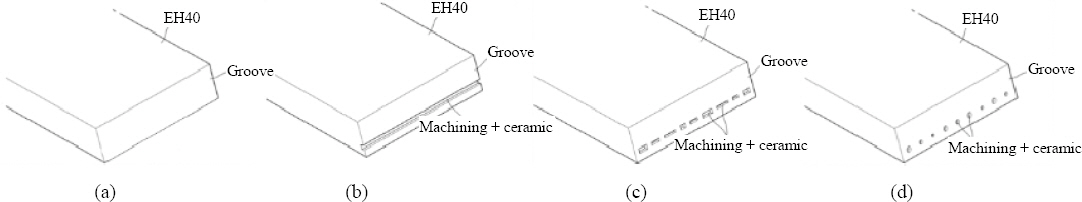
Method of specimens (a) No defect, (b) Long surface, (c) Through thickness, (d) Embedded
Defects type of fatigue test specimens (a) No
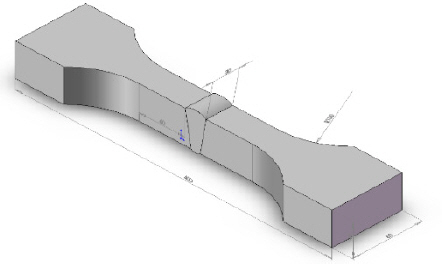
Fatigue test specimens
2.3.2 피로시험 결과
피로시험 조건은 응력비(R) 0.1, 파형은 정현파(Sine wave), 주파수(Frequency)는 2 Hz ~ 10 Hz를 적 용하였으며, 결함 유형별 피로 시험 결과는 식 (2)를 이용하여 Fig. 7과 Table 7에 나타내었다. No defect Critical Assessment)를 BS 7910 code에 따라 실 조건에서는 FAT 80 대비 높은 Fatigue limit를 나타내 었으나, 결함이 표면이나 내부에 존재하는 경우 FAT 80 대비 낮은 Fatigue limit를 나타내었다9,10). Embeded defect와 Through thickness defect 조건의 경우 결 함이 생성된 위치가 표면에 가까운 경우 피로 수명이 감소하고, 중심부에 가까운 경우 피로 수명이 증가하여 결과의 산포가 크게 매우 크게 나타난 것으로 판단된다.
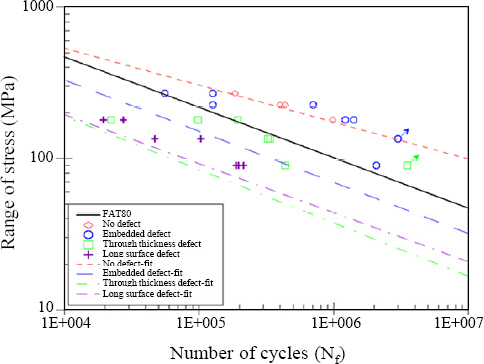
Nominal S-N curve

Fatigue test results by defect type
N: Number of cycles, S: Stress range(MPa), m: Slope, Log(A): Intercept of log N axis, tdof,a: Student’s T-distribution value, se: Standard deviation
2.4 EGW 용접부의 구조물 건전성 평가
Table 5의 CTOD 결과를 이용하여 파괴 역학에 기 반을 둔 구조물 건전성 평가(ECA: Engineering Critical Assessment)를 BS 7910 code에 따라 실시하였다11). Fig. 8은 FAD curve의 예시로, X축은 식 (3)과 같이 재료의 하중과 구조물에 발생되는 하중 의 비율, Y축은 (식) 4와 같이 재료의 파괴인성특성과 구조물에 발생되는 파괴인성특성의 비율을 나타내며, 그 림에 나타낸 바와 같이 구조물의 사용 수명 동안에 결함이 성장하여 파손한계라인(FAL: Failure Assessment Line)의 하단부에 존재하면 구조물의 파손이 발생되지 않음을 의미한다12).
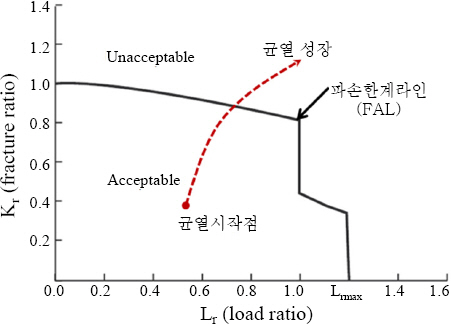
FAD curve
σref = Stress of structure, σy = Stress of material deviation
Kmat = Stress intensity factor of structure,
KI = Stress intensity factor of material
ECA 평가를 위하여 사용한 Parameter는 Table 8 과 같이 컨테이너선에서 EGW 용접이 적용되는 Side shell & Longitudinal bulk head의 구조 강도, 잔 류응력, 구조물의 크기 및 두께와 EGW 용접 시 발생 될 수 있는 결함의 형태를 고려하였다.

ECA parameter
ECA 평가 결과 Allowable defect size는 Table 9 와 같으며, Long surface defect은 1 mm, Through thickness defect은 3 mm, Embedded defect은 7 mm까지 허용 가능한 수준임을 확인하였다.

ECA results
3. 고 찰
Table 7의 결함 유형별 97.7% 신뢰수준에서의 Fa- tigue limit와 Table 9의 ECA 결과를 비교하여 실제 Defect size 수준을 예측해보고자 결함 크기와 Fatigue limit와의 관계를 Fig. 9에 나타내었다. Long surface defect, Through thickness defect, Embedded defect 모두 Defect size가 증가함에 따라 Fatigue limit가 감소하는 경향을 보였으며, Defect size의 증가에 대한 Fatigue limit의 감소량은 Long surface defect, Through thickness defect, Embedded defect 순 으로 확인되었다.
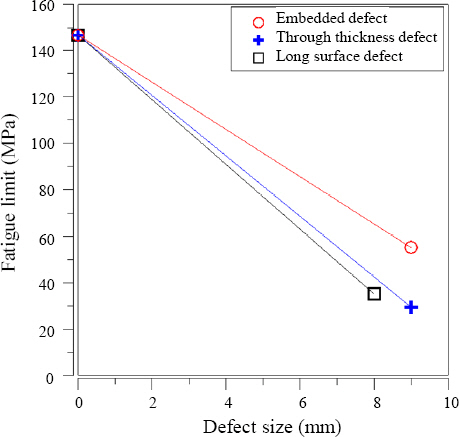
Comparison of defect size and fatigue limit
Fig. 9에서 결함 유형에 따라 Defect size에 따른 Fatigue limit 감소량을 식으로 나타내면 다음과 같이 표현할 수 있다.
Allowable defect size(mm), Y: Fatigue limit at 2 million cycles (Δ Stress)
식 (5), 식 (6), 식 (7)를 이용하여 Defect size별 Fatigue limit와 IIW에서 제시하는 FAT 80 조건에 서의 Defect size를 Fig. 10에 나타내었다. Fig. 10 (a) 와 같이 ECA평가 결과의 Defect size에 대한 Fatigue limit는 Long surface defect가 1 mm인 경우 133 MPa, Through thickness defect가 3mm인 경우 108 MPa, Embedded defect가 7 mm인 경우 75 MPa 수준이었으며, Fig. 10 (b) 와 같이 IIW에서 제시한 FAT 80을 기준으로 Defect size를 추정하면 Long surface defect는 4.8 mm, Through thick- ness defect는 5.1 mm, Embedded defect는 6.6 mm이었다.
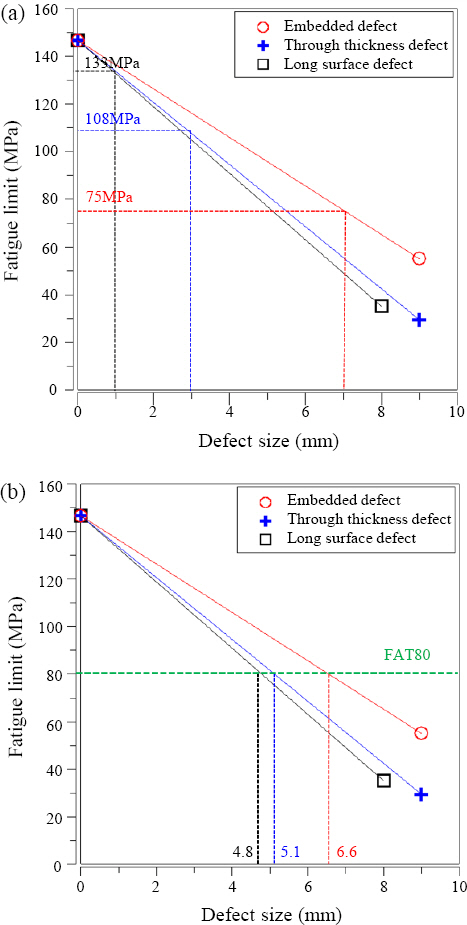
Comparison of defect size and fatigue limit, (a) ECA analysis, (b) FAT 80
결함이 존재하는 경우에 있어서의 Fatigue limit와 ECA 평가를 비교한 결과를 Fig. 11에 나타내었다. Long surface defect와 through thickness defect 의 경우에는 ECA 평가 결과가 피로시험결과보다 보수적인 결과를 나타내었으나, Embeded defect는 유사 한 수준의 결과를 나타냄을 확인하였다.
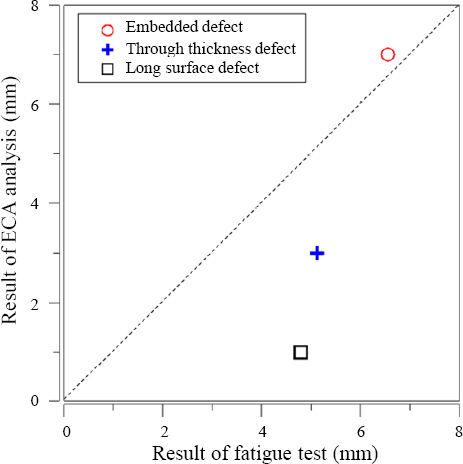
Comparison of fatigue limit and ECA analysis
4. 결 론
컨테이너선에 적용되고 있는 EH40강에 대하여 대입열 용접공법인 EGW 공법을 적용하여 파괴인성(CTOD) 및 결함 유형별 피로 특성을 평가하였으며, 평가된 시 험결과를 바탕으로 구조물의 건전성 평가를 실시하여 다음과 같은 결과를 얻었다.

Allowable defect size according to defect type
1) 결함 유형별 Allowable defect size는 내부에 존 재하는 Embedded defect, Through thickness de- fect, 표면에 존재하는 Long surface defect 순으로 감소하였으며, 결함 유형별 피로시험 결과에서도 동일 한 경향을 나타냄을 확인하였다.
2) 건전성 평가를 통해 도출된 대형 컨테이너선의 EGW 용접부에 대한 결함 유형 별 Allowable defect size는 아래와 같다.
감사의 글
이 과제는 부산대학교 기본연구지원사업(2년)에 의하 여 연구되었음
이 논문은 부산대학교 BK21 4단계 친환경 스마트 조 선해양공학 교육연구단의 지원을 받아 수행된 연구임