Optimization of Friction Stir Welding Parameters of AA2014-T6 Alloy using Taguchi Statistical Approach
Article information

Abstract
Abstract
In this study, the Taguchi Design of Experiment method was used to determine the optimal Friction Stir Welding (FSW) parameters for improving the mechanical properties of AA 2014-T6 alloy butt joints. The three most significant parameters - tool rotational speed, tool linear travel speed and tool tilt angle - were optimized using the L9 orthogonal array design. The optimal welding parameters for the maximum tensile strength were determined by analyzing the signal-to-noise (S/N) ratio. A regression model was developed for the desired responses. The optimal tensile strength was achieved at the 1000 rpm, rotational speed, 600 mm/rev welding speed, and 2 ° tool title angle. The results were confirmed using a steady-state heat transfer model generated from the COMSOL Multiphysics Finite Element software. The identified optimal conditions were verified by experimental validation tests. The experimental results were consistent with the predicted values. Analysis of variance (ANOVA) was conducted to determine the effects of individual parameters and to identify the most significant process parameter. ANOVA indicated that the most significant factor affecting the mechanical behavior of the joint was the tool rotation speed followed by the linear travel speed.
1. Introduction
Aluminum alloys are the key structural materials for transport, aerospace, building construction, marine and defense applications. This is due to their high specific strength, useful mechanical properties, design adaptability as well as easy fabrication and processing. In comparison to other aluminum alloys, the 2xxx series containing copper, magnesium and manganese have higher strength resulting from the age hardening precipitates, superior damage tolerance and good resistance to fatigue crack growth. AA2024, AA2219 and AA2014 are well known alloys in this group1). AA2014 is commonly used in heavy duty forgings, plates and sheets, aircraft components, wheels, major structural components, space booster tanks and heavy duty road and rail vehicles2). It is widely used in the structures that require high strength to weight ratio, high fracture toughness, good fatigue resistance and durability.
Friction Stir Welding (FSW) is a recently developed technique of joining metals that are difficult to weld using conventional fusion methods. The technique is being progressively practiced for welding of similar as well as dissimilar metals with ease. This technique has the benefit of being a solid-state process which alleviates the need for liquid filler metals that are common with conventional fusion welding techniques. This novel technique has also substituted the traditional joining processes like mechanical fastening and has increased the possibilities of process automation. The FSW process is fast and can be easily automated to be used in any orientation without the influence of gravitational effects on the process3-5). The FSW process is a highly consistent joining process with high reproducibility and is effectively used in several high-tech industries such as automotive, railway, aerospace and aeronautics. Prominent features of this technique are absence of segregation, porosity, hot cracking, high temperature phase transformations and results in low distortion, low residual stresses, good surface finish and improved mechanical properties. In addition, this method yields better joint and energy efficiency5-7).
The process uses a non-consumable rotating tool with specially designed pin and shoulder, having superior mechanical properties than the metal to be welded. The rotating tool is forced into the joint line. As a result of friction between the tool and the work piece, sufficient amount of heat is generated that softens the material up to a plasticized or semi-solid state. Subsequent translational movement of the tool along the joint line stirs the plasticized material around the joint line and, as the tool moves forward the faying surfaces are fused8-10). Friction stir welding involves various process parameters, out of which the significant are tool rotation speed, tool travel speed and tool tilt angle. Weld quality and mechanical characteristics are highly influenced by these parameters. A slight maladjustment in these parameters can result in inappropriate softening of the material and causes defects in the weld. If the material softening is less than a critical value, defects like tunnel, kissing bond, root cracks, etc. may occur. Excessive flash, voids, surface cracks like defects may be observed when there is excessive softening of the material11,12). Therefore, it is of fundamental importance to properly optimize the process parameters. In general, optimization is carried out by considering a set of pre-defined process parameters, such as tool rotational speed, tool linear travel speed, tool tilt angle, axial force, tool shoulder to pin diameter ratio, etc., keeping in mind some intended objective parameters such as maximum temperature generated, yield strength, ultimate tensile strength, hardness, impact strength, etc.6,13,14). Most of the engineering processes have a large number of factors that influence the final product. Identification of their individual contributions and their intricate interrelationship is necessary to design a process15). Classical experimental approach is generally employed for this purpose. This approach is not only time consuming, expensive but also inaccurate because it depends on trial-and-error based analyses. Now-a-days more robust statistical methods are being utilized for process optimizations. These approaches not only save time and cost but also give near-optimal results. Researchers have extensively used various statistical approaches for the optimization of performance characteristics in many engineering analyses. Various techniques have been used for optimization of Friction Stir Welding parameters including Response Surface Methodology (RSM), Taguchi, Full Factorial (FF), Genetic Algorithm (GA), Multiple Regression Analysis (MRA), Analysis of Variance (ANOVA), Regression Analysis (RA), Artificial Neural Networks (ANN), Finite Element Analysis (FEA)6,13,16). Many of these Design of Experiment (DoE) practices need large number of experimentation. In many industrial problems, carrying out a large number of experiments is not feasible. In this respect, Taguchi orthogonal array approach has gained much popularity due to its simplicity, efficiency, low-cost and excellent quality. As an example, the Full Factorial process will need a total of 81 (34) experiments for a process optimization with four factors and three levels each. With Taguchi Method, the same optimization will be accomplished with only 9 tests by utilizing L9 (32) orthogonal array approach17). It has been observed that, among AA2xxx series, the research works mainly focuses on friction stir welding of AA2024 and AA2219. The advent of Friction Stir Welding has opened the door for structural applications of AA2014 on large scale. Currently, most of the reported data regarding optimization of friction stir welding of AA2014 is limited to thick plates and the work on thin sheets is lacking.
In the present study, friction stir welding parameters for thin AA2014 sheets (thickness < 3mm) were optimized using Taguchi L9 orthogonal array approach for optimal mechanical properties of the welded joint. Analysis of Signal to Noise ratio (S/N) and Analysis of Variance (ANOVA) were used to assess the significance of individual parameters. Heat generated and maximum temperature attained during each experiment was assessed with the help of steady state heat transfer model using COMSOL Multiphysics Finite Element software and correlated with the optimized combination of parameters.
2. Experimental Methods
2.1 Materials
The material used in this study was commercially available rolled sheets of AA2014 alloy. The chemical composition and mechanical properties of the chosen material are given in Table 1 and 2, respectively. The blanks of 250 × 80 × 2.4 mm dimension were cut from the sheet by shear cutter. The pieces were then subjected to T6 treatment by solutionizing at 510 ℃ followed by warm water quenching. Artificial Aging was then performed at 170℃ for 16 hours in an electric oven. In order to get smooth and parallel faying edges, the sheared edges were milled on a milling machine. The edges were rubbed by emery paper just before welding to remove surface oxides followed by cleaning with hydrocarbon solvent to wipe out dirt, grinding debris and oil remnants.

Chemical composition of the material, wt.%

Mechanical properties
2.2 Friction Stir welding
The friction stir welding was carried out on a computer-controlled numerical vertical milling machine. The tool used was made of hardened and tempered H13 tool steel having an eccentric grooved shoulder of ϕ10mm and a threaded taper pin of ϕ4mm. The length of the pin was 2.25mm. All the welds were in butt joint configuration. The welding, of equal lengths of 200 mm, was done in a single pass, perpendicular to the rolling direction of the sheet along the long edges of the blanks. A typical welding setup is shown in Fig. 1, showing the clamping and welding arrangements.

A typical friction stir welding setup
2.3 Selection of parameters and levels
From the reported data, it is observed that the most effective factors that influence the tensile properties of friction stir welded aluminum joints are tool rotation speed, linear travel speed and tilt angle. Three levels of each factor were selected for optimum tensile properties of the welded joints. The factors used in this work and their levels are presented in Table 3 and 4.

FSW process factors and levels

Constant process factors
2.4 Orthogonal array experiment
The effect of above mentioned factors was studied using Taguchi L9 (3^3) orthogonal array design. The Ultimate Tensile Strength (UTS) was taken as the response parameter. The objective was to achieve a maximum value of the response. Minitab statistical software was used to develop experiment matrix, as presented in Table 5, and subsequent data analysis.

Taguchi orthogonal array matrix of experimental plan
2.5 Tensile Testing
After developing the orthogonal array, next step in Taguchi optimization scheme is to carry out the experiments as per design matrix. The welding was done as described in section 2 according to the parameters outlined in the experimental plan. The welded samples were initially examined by Radiographic Testing (RT) to confirm that the welds were defect-free. The tensile test samples with a gage length of 25mm were cut from the as-welded coupons, perpendicular to the joint with the help of EDM wire cutting machine as per ASTM E818). The uniaxial tensile testing was performed on Universal Testing Machine, with a load cell of 100 kN and high resolution extensometers. All the tensile tests were performed at cross head speed of 0.5mm/min. The testing was performed at room temperature.
3. Results and Discussion
3.1 Tensile Test Results of Taguchi Matrix
The tensile test results of each set of Taguchi orthogonal L9 design are summarized in Table 6. The table shows ultimate tensile strength and the weld efficiency (ratio of weld/base) obtained in each experiment. It is observed that the efficiency of set no. 9 is maximum whereas it is minimum for set No. 3.

Experimental results of responses for taguchi L9 design
3.2 Signal to Noise Ratio (S/N)
The influence of chosen welding parameters on the selected response was estimated by computing the S/N ratio for each welding parameter. The signal to noise ratio, which is log functions of desired output, reveals the amount of scatter with respect to the targeted response, under different combinations of FSW parameters. When the ratio is large, the scatter is small. Signal to noise ratio helps in data analysis and prediction of the optimum results. The tensile test results were examined to determine the influence of FSW parameters and then converted into respective signal-to-noise (S/N) ratio as shown in Table 7.

Calculated S/N ratios for UTS responses
Since the target of this study was to maximize the tensile properties, the S/N ratio was chosen according to the criterion of larger-the-better using the following expression:
Where ‘n’ is the total number of experiments and ‘yi’ is the observed result (response) of each experiment. The calculated S/N ratio values (mean) as per equation (1) are given in Table 8 and graphically presented in Fig. 2. The maximum effectiveness ranks were calculated on the basis of delta values which represent the variance (scatter) between the highest and lowest average response values for each factor.

The S/N ratio analysis for tensile test results
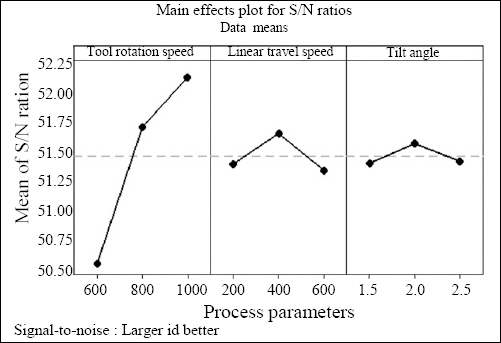
Plot of S/N ratios for UTS mean responses
It is evident from the graphical data (Fig. 2) that mean values of S/N ratio increase with increase in ‘Tool rotation speed’. It means that the weld joint efficiency increases with increase in ‘Tool rotation speed’. However, UTS initially increases and then decreases with increasing values of ‘Linear travel speed’ and ‘Tilt angle’. The dashed line in the Fig. 2 shows the value of the overall mean of all the S/N ratios19).
The normal probability plot of UTS responses are presented in Fig. 3. The Normal probability plot of residuals shows that all the data points fit reasonably in a straight line and do not deviate significantly from normality. Thus, it can be concluded that the model is significant and errors have normal distribution20). Since it is unreasonable to check the existence of non-linear element in the relationship between process parameters and the UTS of the weld joints, the analyses are based only on center points.

Normal probability plot of mean responses
3.3 Interaction Plots for response analysis
Interaction plots can be effectively used to explore the potential relationship between the process parameters and responses based on a model21). Interaction plots in the form of 2D contours were plotted to analyze the relation of the chosen process parameters with the selected response i.e. UTS and are shown in Fig. 4. It is evident from the plots that the maximum tensile strength is achieved when ‘Tool rotation speed’ is around 950 - 1000 rpm and ‘Linear travel speed’ is about 400 to 600 mm/min.
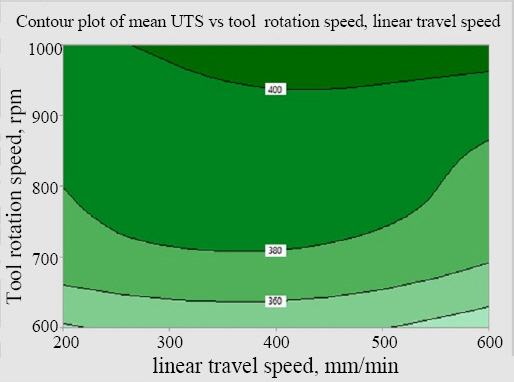
Interaction contour plot between ‘Tool travel speed’ and ‘Linear travel speed’ for ultimate tensile strength
3.4 Estimation of optimum parameters
On the basis of S/N ratio analyses and Main effect plot of mean S/N ratio, it appears that the UTS can be maximized at ‘Tool rotation speed’ of 1000 rpm (AI), ‘Linear travel speed’ of 400 mm/min (BII) and ‘Tilt angle’ of 2° (CII). However, interaction contour plots show that the maximum properties can also be achieved at ‘Tool rotation speed’ of 960 to 1000 rpm and ‘Linear travel speed’ of 400 to 600 mm/min also.
3.5 Prediction of optimum parameters by Regres- sion Equation
In addition to determine how the response changes when the values of the process parameters are changed, the other key benefit of regression is its ability to make predictions21). Prediction in regression refers to estimating the value of one variable using assumed values of other input variables that are related to it. A regression fit equation was developed by analyzing the mean UTS against the chosen process parameters. Equation 2 describes the regression model for the present case.
Where ‘A’ is ‘Tool rotation speed’; ‘B’ is ‘Linear travel speed’ and ‘C’ represents ‘Tilt angle’. The predicted UTS at different process parameters, based on Equation 2 are given in Table 9. The data in Table 9 show that reducing the ‘Tool rotation speed’ results in lowering the UTS of the friction stir welded joints from 409 MPa to ~ 400 MPa whereas increasing the ‘Linear travel speed’ from 400 mm/min to 600 mm/min has no effect on the resultant properties. The tilt angle is kept at 2° in all calculations. On the basis of these calculations it is clear that the option of 950 rpm for ‘Tool rotation speed’ can be ignored.

Predicted mechanical properties
3.6 Prediction of optimum parameters by Theoretical and Numerical modeling
So far it was not clear what should be the final set of optimum ‘Linear travel speed’ to maximize the UTS of the friction stir welded joints. Therefore, an attempt was made to make a decision on the basis of maximum temperature attained and the heat distribution in the welded joint. The maximum temperature attained during friction stir welding greatly influences the mechanical properties of the welded joint22-26) due to the dissolution of strengthening precipitates and grain coarsening. The estimation was done by theoretical calculations as well as by numerical modeling. For the estimation of maximum temperature attained during friction stir welding of aluminum, the expression as proposed by Arbegast et. al.27) was used and is reproduced as Equation 3.
Where T and Tm (℃) are maximum and melting temperature, respectively, ω is ‘Tool rotation speed’, ν is ‘Linear travel speed’ and K and α are constants (taken as 0.7 and 0.05 respectively). The results obtained for maximum temperature are reported in Table 10. The results show that for combination 1000/600/2, maximum temperature attained has the minimum value.

Theoretically predicted maximum temperatures
The same trend was shown by numerical modeling, which was done using COMSOL Multiphysics Finite Element software. The results are presented in Fig. 5 (a-c) and are included in Table 10.

Maximum temperature attained at different process parameters (a) 1000,400,2 (b) 1000,500,2 (c) 1000,600,2
3.7 Selection of optimum parameters
On the basis of analyses carried out in section 5.2 to 5.6, it was inferred that the tensile strength of the friction stir welded joint of AA2014-T6 can be maximized by using the following process parameters
• Tool rotation speed: 1000 rpm
• Linear travel speed: 600 mm/min
• Tilt angle: 2°
3.8 Validation Test
After the selection of optimized process parameters, next step was to carry out confirmatory test by utilizing optimum parameters. The maximum UTS achieved was 412 which was very close to the predicted value by the regression equation (see section 5.5). The experimental results confirmed the suitability and effectiveness of the model used for the selection of optimum parameters of friction stir welding of AA2014-T6 alloy.
3.9 Analysis of Variance (ANOVA)
Taguchi experimental method does not provide the effect of individual process parameters on the targeted outputs (UTS in this case), it is necessary to utilize some statistical tool to compute the relative importance of each process parameters and its effect on the predefined outputs. The effectiveness of each parameter was determined by Analysis of Variance (ANOVA) because it can explicitly define the extent to which each process parameter affects the response and also the fraction of contribution of the individual process parameters on the response. The ANOVA analysis was carried out at 95% confidence level. The significance of process parameters was determined by comparing ‘F’ and ‘p’ values. The ‘F-value’, known as ‘Fisher value’ or ‘Variance ratio’, determines which parameter is the most significant. The process parameter with higher ‘F-value’ is considered to impart more effect on the process responses. Similarly, ‘p-value’ also determines the significance of process parameters. Lower the ‘p- value’ greater is the influence of that parameter on the response. Generally, if the ‘p-value’ is less than 0.05, it means that the parameter has a significant influence on the process response. The contribution of each process parameter was also determined as percentage. The results of ANOVA analysis of mean UTS are given in Table 11. The analysis shows that F-value for ‘Tool rotation speed’ is the highest which means that it is the most influential factor on the UTS of friction stir welded joints. Slight variation in in this parameter can cause significant changes in the UTS of the joints. The F-values of other two process parameters are very low and have a minor role in affecting the UTS of the weld. Same can be concluded from p-value which is less than 0.05 for ‘Tool rotation speed’. The analysis also shows that the ‘Tool rotation speed’ has 92.3% contribution in affecting the output response. The accuracy of the model with the experimental results was checked with the help of coefficient of determination, R2. This coefficient is a statistical number which shows how much the data is fitted to the regression line. The measured value of R2 is 97.46% as shown in Table 10. As this value is almost equal to one, it can be concluded that the developed model has high accuracy8,22).

ANOVA results for mean UTS
4. Conclusions
In this study, optimal process parameters to maximize the tensile strength of friction stir welded butt joints of thin plates of AA2014-T6 alloy, were accessed using the Taguchi statistical analysis technique. Three levels of three most effective process parameters vis-a-vis ‘Tool rotation speed’, ‘Linear travel speed’ and ‘Tilt angle’ were used. Identification of the most significant and insignificant parameters was done along with quantified contribution of each parameter. The following conclusions are drawn on the basis of analytical, numerical and experimental analyses:
1) Taguchi Design of Experiment technique can be efficiently used to optimize the process parameters of friction stir welding process of thin sheets of aluminum.
2) S/N analysis showed that the maximum tensile strength can be attained when values of ‘Tool rotation speed’, ‘Linear travel speed’ and ‘Tilt angle’ were 1000 rpm, 400 mm/min and 2°, respectively. The attainable UTS was 409 MPa.
3) Since heat generated during FSW has great influence on the tensile strength of the joint, Interaction Contour plots and regression analysis were used to refine the optimum parameters. The results showed that the same tensile strength can be achieved by utilizing a higher ‘Linear travel speed’ of 600 mm/min.
4) The theoretical analysis and FE modeling showed that welding at higher ‘Linear travel speed’ can offer same results at lower peak temperature.
5) A maximum tensile strength of 412 MPa was achieved by the FSW joint made by the optimized parameters of 1000 rpm ‘Tool rotation speed’, 600 mm/min ‘Linear travel speed’ and 2° ‘Tilt angle’.
6) ANOVA analysis demonstrated that ‘Tool rotation speed’ has the most significant effect on the tensile strength of the joint with 92.3% contribution followed by ‘Linear travel speed’ and ‘Tilt angle’ having 4% and 1.16% contribution respectively.