Recent Research Trend of Arc Welding Quality Monitoring Technology in Korea
Article information

Abstract
Welding-monitoring technology measures and analyzes changes in process variables and welding quality using various sensors suitable for the process type and conditions of the real-time welding process and after the welding process. Welding monitoring makes it possible to evaluate the weld quality, set optimal welding conditions, and provide real-time feedback control of process variables through analysis. Methods for arc-welding monitoring include those based on camera sensors, current and voltage waveforms, and laser vision sensors. With the development of sensors and related technologies, welding monitoring has been extensively studied. This paper presents the latest development trends concerning arc-welding monitoring technology for various welding processes in Korea.
1. Introduction
Arc welding is the most basic process among the welding processes. It can be used to weld not only steel but also lightweight materials, such as aluminum, and is applied in various industries such as automotive, construction, shipbuilding, and plants. This welding process is a fundamental technology in all manufacturing industries, and quality control of welds is very important to ensure safety and reliability. For quality control of welds, monitoring technology that observes and analyzes welding phenomena and results during the entire welding process is essential, and its importance has been growing in recent years. Each welding process has its own characteristics that can be monitored, as each process has different characteristics. For arc welding, among various processes, there are mainly two monitoring methods of weld quality. The first one is to measure and analyze the welding phenomenon during the welding process in real-time using various sensors. Real-time welding process monitoring techniques include those that monitor welding process-related parameters (arc welding current and voltage, etc.) and those that monitor arc welding phenomena using camera sensors to predict quality. The second one is to use laser vision sensors or artificial neural network learning to predict weld defects or quality after welding. Welding process monitoring technology has been advancing based on a lot of research owing to the advancement of various sensors and related technologies. This made it possible to monitor welding phenomena and results, which were difficult to measure or analyze in the past. In this paper, we will introduce the recent technology trend in monitoring arc welding, among various welding processes, focusing on South Korean technologies.
2. Research Trend
2.1 Camera Sensor-based Arc Welding Monitoring Technology
Arc welding monitoring technology using cameras is based on the analysis of images acquired using cameras. Recently, cameras have been widely used for real-time welding process monitoring due to their advantages of non-contact measurement method and high accuracy and precision1-8).
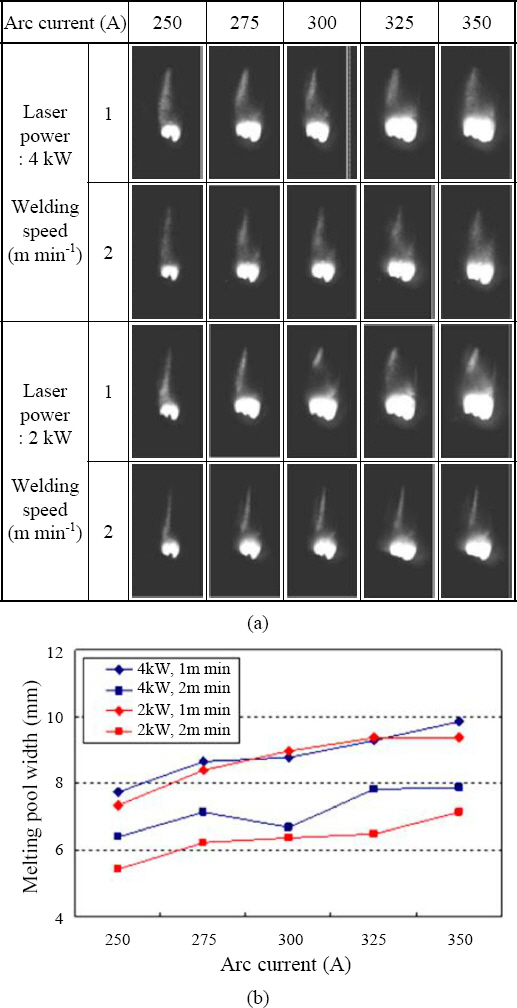
Kim et al. evaluated the influence of process parameters on the weld pool width in the laser-arc hybrid welding process using a coaxial monitoring system capable of capturing optical signals from the weld pool and keyhole5). Real-time images of the weld were captured to analyze the bead width based on changes in laser power, welding speed, and arc current, and the monitoring system was validated using the ANOVA (ANalysis Of VAriance) technique. This proved that the factors affecting the weld pool width are arc current and welding speed. Fig. 1 shows the change in the monitored weld pool shape and the measured melting pool width according to arc current. As the arc current increases, the wire melting and feed rate increases with the arc size. As the welding speed decreases, the time and amount of wire melted per unit length increases, indicating that the welding speed and arc current are closely related to the weld pool width. The arc, keyhole stability, and melting pool width obtained from the weld pool image using the camera can be analyzed as a function of process parameters (such as laser power, welding speed, and welding current), and the monitoring system can be validated through statistical processing.
Cameras are used to monitor not only the weld pool but also metal transfer phenomena. Lee et al. performed plasma-MIG (Metal Inert Gas) hybrid welding on Al5083 alloy and monitored it6). During welding, MIG welding current and voltage data and plasma current and voltage data were collected in real-time. In addition, a Charge-Coupled Device (CCD) camera was used to observe the welding process, and photodiodes were used to measure the light intensity. As a result, the bead shape was classified according to each metal transfer, and the tensile strength was compared between each bead shape to evaluate the strength of the weld according to the metal transfer. Figs. 2 and 3 show the waveforms and images of the granular transfer mode, respectively. In the globular transfer mode, the arc length is longer than in the short-circuit transfer mode because the wire is not in contact with the molten pool. Since no short circuit occurs, the voltage waveform remains constant, and because of the arc light intensity, the light signal value of the photodiode is also higher than in the short-circuit transfer mode. Furthermore, as shown in Fig. 3, the instantaneous light intensity increases when the weld moves away from the wire. By analyzing the images and waveforms obtained using the camera sensor, the bead shape can be classified, based on which the tensile strength can be evaluated and compared.


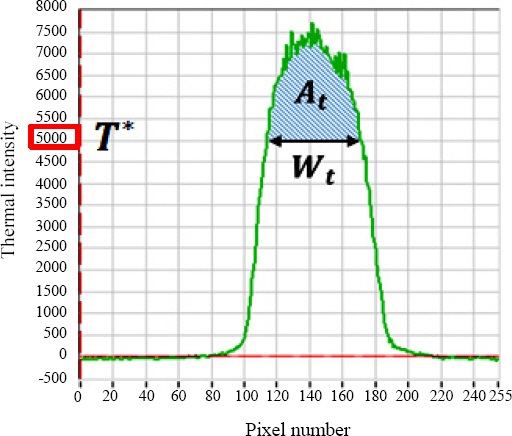
Park et al. analyzed the quality of arc welds using thermal images of welds using a thermal imaging camera7). They used an ultra-high-speed thermal imaging camera to obtain thermal images of Flux Cored Arc (FCA) welds and then predicted weld quality such as bead shape and weld defect occurrence. They found that the bead width is linearly related to the thermal intensity width, and the bead height is linearly related to the thermal intensity area. Fig. 4 shows the thermal intensity distribution obtained from the thermal image. Wt is the width of the region above a certain thermal intensity (T*), and At is the area of the region where the thermal intensity is above T*, which is a parameter related to the thermal energy contained in the region. The thermal intensity width and thermal intensity area extracted from the thermal intensity distribution obtained from the thermal image can be used as useful evaluation parameters for estimating weld quality such as bead width, bead height, and defects.
Kim et al. proposed an algorithm for image processing in gas metal arc (GMA) welding based on a thermal imaging high-speed camera8). Through experiments, they tested and optimized the proposed algorithm and then verified the validity of the proposed algorithm using welding arc line images obtained from different welding environments. The results show that the proposed algorithm performs excellently in terms of variable denoising and feature point and centerline extraction in vertical GMA welding.
Overall, the trend of camera sensor-based arc welding quality monitoring technology in South Korea is dominantly led by research on bead shape classification based on analysis of images acquired using cameras (weld pool, metal transfer mode, thermal image, etc.) and correlation analysis with welding process parameters such as current and voltage, and research on welding quality monitoring based on this.
2.2 Arc Welding Process Parameter Sensing-based Monitoring Technology
One of the most popular methods among the arc welding process monitoring techniques is to monitor the weld quality through the sensing of process parameters such as current and voltage. Arc stability and weld defects can be predicted by monitoring process parameters such as current and voltage.
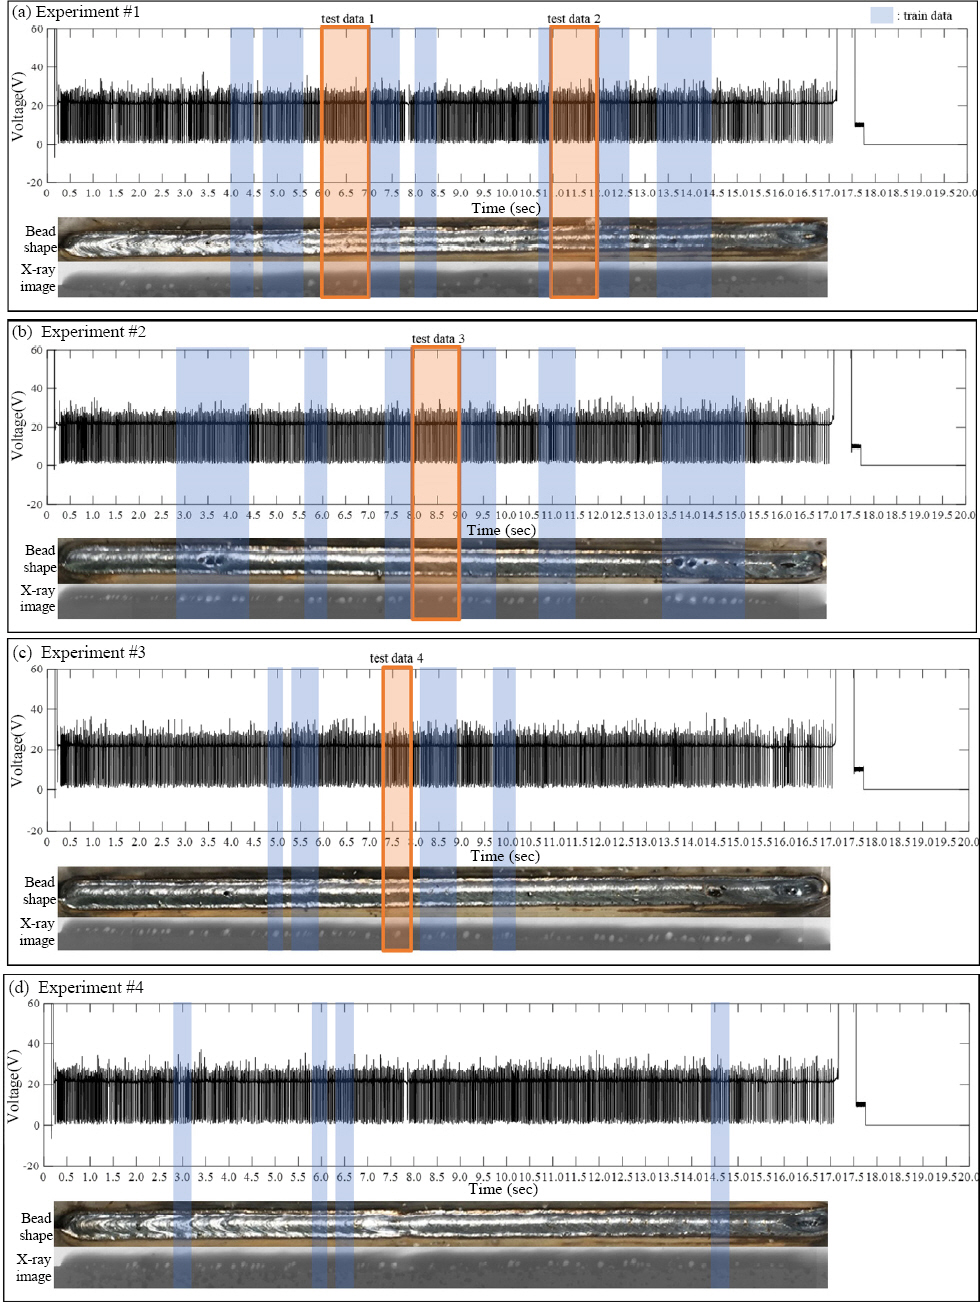
Yoon et al. developed an algorithm to determine the stability of the arc and whether defects occurred in the weld by measuring the current waveform and pulse frequency during GMA welding and then determined the weld quality through experiments9). To detect welding defects, they used a method using the upper and lower limits of the current and a high-speed Fourier transform of the current’s frequency band. In this way, weld quality can be monitored by measuring the current waveform and pulse frequency, but it may be difficult to accurately judge parts such as the unstable arc at the welding start point if there is an external noise problem. By extracting feature variables from the monitoring results of arc welding process parameters and optimizing them through machine learning, it is possible to monitor welding defects in real-time. Lee et al. monitored pores in real-time by applying a genetic algorithm (GA) that extracts feature variables from arc voltage signals generated during welding and optimizing the initial parameters of the Deep Neural Network (DNN) of a porosity detection algorithm trained with feature variables10). Fig. 5 shows the welding voltage waveform (measured for 20 seconds at a sampling rate of 10 kHz), bead shape, and x-ray image obtained in welding experiments. Feature parameters are derived from the sampling data through signal analysis and optimized using GA. As a result of applying the experimental data of GMA welding using high tensile galvanized steel plate to the optimized DNN model, the prediction accuracy of 93.1% was shown for the occurrence of pores in the weld.
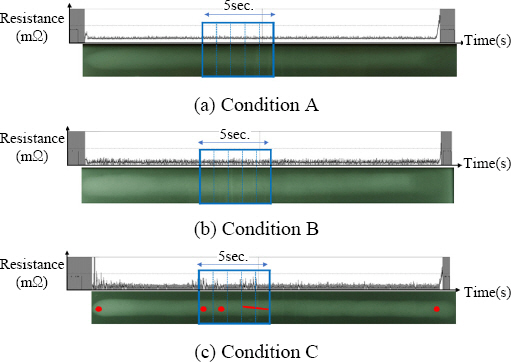
Ju et al. developed a defect detection algorithm using the interval statistical processing method that expresses the status information in the welding current and voltage waveforms as a time series11). For Flux Cored Arc Welding (FCAW) of carbon steel, a defect detection algorithm was developed using the interval statistical processing method of welding waveforms. Then, the detection results were compared with Radiographic Testing (RT) results of defective samples to analyze the correlation with phenomena such as arc’s short circuit, restrike, and wire sticking in the case where there is a lack of weld or there are weld pores. Fig. 6 shows the welding resistance waveform and RT film results for the three conditions used for the interval statistical processing. The monitoring system was used to analyze 50,000 welding resistance data acquired for 5 seconds each at a sampling rate of 10 kHz per second, and a total of five intervals were compared for time-series interval analysis. Based on the interval statistical processing method of arc welding transforms, they proposed a model, in which the arc length becomes longer, the current becomes lower, and the resistance becomes larger at arc restrike after the occurrence of prolonged short circuit, resulting in a lack of fusion or generation of pores. It was determined that the 0.1-second interval was optimal in terms of data processing efficiency when using the maximum resistance for each interval in welding waveforms.
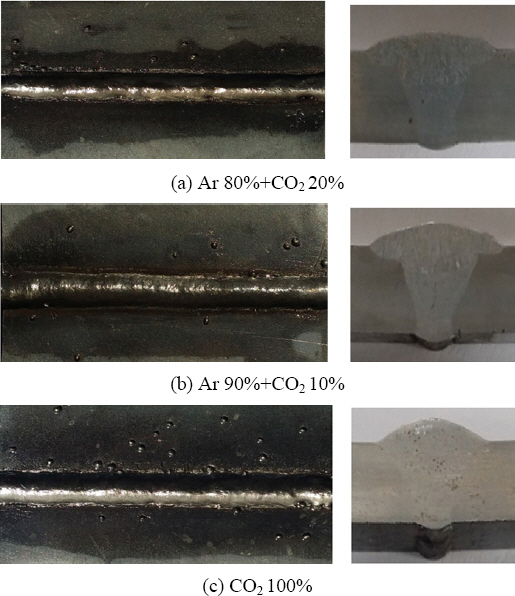
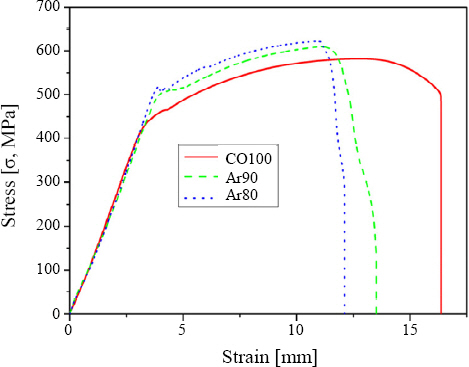
Oh et al. obtained current and voltage data in real-time using a welding monitoring system for Gas Tungsten Arc (GTA) welding and developed an algorithm to determine whether defects such as non-welds and pores in GTA welds occurred or the location of defects in real-time12). The weld quality was checked using a 3D scanner by determining the occurrence and location of defects in the actual weld bead. Furthermore, a DNN algorithm with a structure of 7 neurons in the hidden layer was used to predict the optimal bead width and predict defects in real-time. Lee studied a real-time welding monitoring technique based on a deep learning algorithm to detect irregular variation in root pass for root-pass welding of butt joint based on the FCA process using only current and voltage signals13). To reduce the time delay in the monitoring process, the ROCKET (RandOm Convolutional KErnel Transform) algorithm was used to classify the gap with good accuracy and high speed, with a classification accuracy of 96.2% and a computation time of 0.399 s. Lim et al. used a monitoring system to evaluate the mechanical properties of the weld according to the shielding gas type in FCA welding for Atos 60 material14). The waveforms of welding current and voltage were measured in real-time as the shielding gas changed, and the mechanical properties of the weld were evaluated to determine their correlations with the shielding gas. Fig. 7 shows the weld bead according to the shielding gas. In terms of bead shape, there was a lot of spatter in the case of CO2 100%, while Ar 80% + CO2 20% at low welding speed produced elegant beads and little spatter. As the mixing ratio of Ar gas increased, the bead width increased, and the height decreased. The welding current and voltage waveforms showed many peaks and large amplitude in the case of CO2 100%. Here, multiple overlapping peaks and inconsistent waveforms appeared, resulting in an unstable arc and a higher probability of spatter generation. Fig. 8 shows the tensile strength results for various shielding gases, and the yield and tensile strength are improved by about 5 to 9% when using mixed gas compared to CO2 100%.
Research has also been conducted on techniques for seam tracking through signal-to-noise (SN) ratio analysis and Contact Tip to Workpiece Distance (CTWD) prediction, along with current and voltage waveform monitoring. Seo et al. conducted a study on the selection of arc sensing signal by analyzing current and voltage waveforms in pulsed GMA welding15). Based on the pulse waveform analysis and SN ratio analysis, they reported that it is reasonable to use the average current as the seam tracking signal not only in the pulse MIG/MAG (Metal Active Gas) synergic mode, but also in the metal transfer control mode and short-circuit transfer control mode. Fig. 9 shows the result of analyzing the SN ratio for each welding mode based on the regression analysis results and deviations. In the pulse MIG/MAG synergic mode, the average current signal has the highest SN ratio value when the current is above 200A, and the peak current has a higher SN ratio when the current is below 200A.
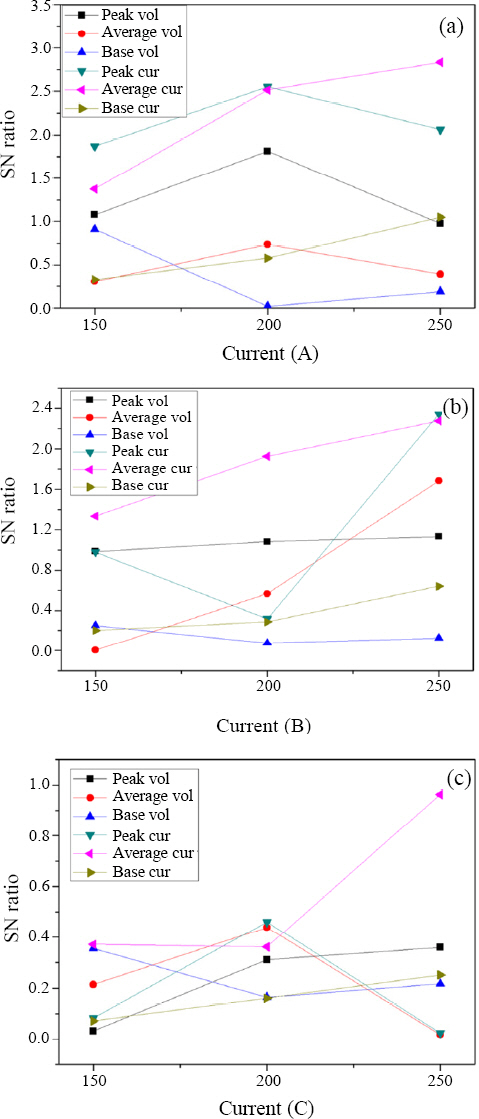
Using machine learning algorithms, Seo et al. also developed a seam tracking algorithm for CTWD prediction using welding current and voltage signals in tandem welding16). The measured signals were separated into peak, average, and base, based on which a seam tracking prediction model using SN ratio analysis with high reliability was derived. Through the SN ratio analysis, it was found that the average current of the lead torch is appropriate as a seam tracking signal in tandem welding, and the comparison with the linear regression model confirmed that the regression tree model using machine learning is the most appropriate model for seam tracking.
As a result of reviewing the process parameter sensing-based monitoring techniques introduced in this study, we have found that the main research direction in South Korea is to measure current and voltage signals during the welding process to detect pores or defects in the weld or to track the seam through classification algorithms. The extraction position and classification criteria of the information obtained through such process parameter sensing monitoring play an important role in improving the accuracy of monitoring.
Research on laser vision sensor-based monitoring technology has been steadily progressing. Recently, many studies have used laser vision sensors to acquire images or videos, processed the images and videos to obtain the information to be monitored, and then applied them to a prediction model to verify or predict the weld quality.
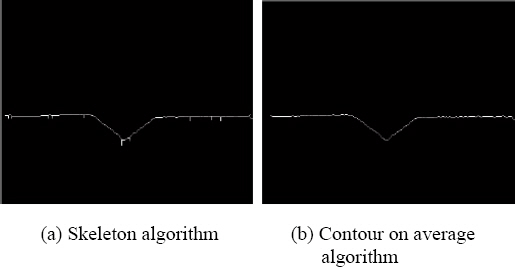
First, there are monitoring techniques that use laser vision sensors for seam tracking. Jin et al. developed an image processing optimization algorithm for real-time seam tracking in GMA welding17). Using a laser vision sensor, the image was acquired by tracking a V-shaped butt-welding seam, and various image processing procedures such as denoising and binarization were performed. Based on this, an optimization algorithm was developed for fast and accurate image processing with high accuracy (99.92%). The optimization algorithm for image processing also showed that a weld joint with the same size as the image size of the laser vision sensor is an important factor in increasing the accuracy and stability of tracking seam edges. Fig. 10 shows the results of centerline detection using the skeleton algorithm and the contour on average algorithm. Noise in the image captured by the camera using the laser vision sensor is removed in a pre-processing step. Image binarization is then performed to improve sharpness and select a threshold value, and the contour on average algorithm is used for gradual weld centerline tracking.
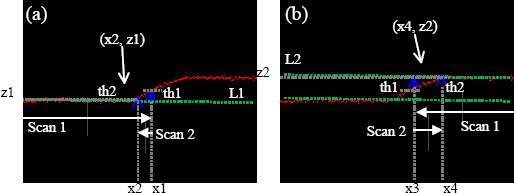
The study introduced above was about butt welds, but monitoring techniques for fillet welds using laser vision sensors have also been studied. Jeong et al. proposed a laser vision sensor-based weld quality inspection algorithm and developed a weld quality inspection system for fillet welding18). With an inspection system composed of a laser vision sensor, an electronic rotary, and an inspection computer equipped with an inspection program, the proposed inspection algorithm effectively detected the main inspection items of the weld bead shape (concave shape, convex shape, neck thickness, etc.) required in the production site. Fig. 11 shows the extraction of the left and right boundary points of the weld bead using the laser vision sensor. Based on the scanned information, the boundary values of the weld bead are extracted by comparing the profile data and threshold values. In this case, the convex shape of the weld bead is not a problem, but when the weld bead is concave, the large measurement error of the bead height is a problem that needs to be solved in the future.
Lee et al. developed a laser vision system and used it to measure the weld bead shape and predict the internal bead shape and tensile strength of the welded joint19). Weld bead cross-section data were obtained through GMA welding experiments, and image processing algorithms were developed and implemented to measure the external bead geometry using a laser vision sensor and detect the features of the weld bead. Based on this information, a DNN model was used to predict the internal bead shape and tensile strength of the welded joint.
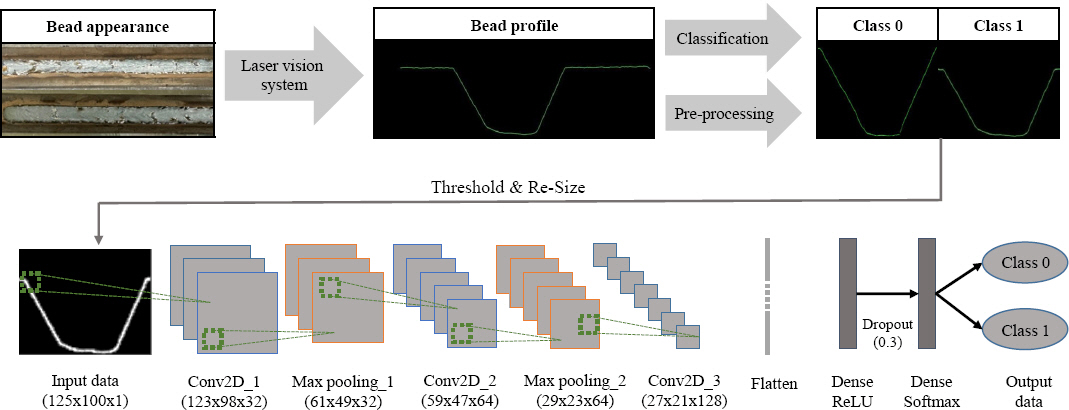
In addition to monitoring techniques for extracting weld bead geometry using laser vision sensors, research has also been conducted on monitoring techniques for determining the occurrence of back-bead. Lee et al. used bead geometry information extracted from a laser vision sensor system to predict the occurrence of backbead in GMA root-pass welding of a V-groove butt joint, and they validated the extracted bead geometry with a CNN model20). The upper-bead shape information was extracted from the welded specimen using the laser vision sensor system, and based on this, an input variable of the CNN model was constructed to predict the occurrence of back-bead. Fig. 12 shows the structure from the acquisition of bead shape information using the laser vision sensor to the prediction of back-bead occurrence using the CNN model. It shows the information of each layer up to the input and output variables. The upper-bead shape information of the section where the back-bead occurred was classified as Class 1, and that of the section where the back-bead did not occur was classified as Class 0. The weld penetration depth was measured using a laser vision sensor, and if it was greater than or equal to 0.2 mm, it was considered to be a full penetration weld and selected as Class 1. By extracting a total of 10,000 data, 5,000 each for bead shape information for Classes 1 and 0, and training with a CNN model, a high accuracy of 99.5% was obtained for predicting the occurrence of weld back-beads.
Unlike the aforementioned studies, there are also techniques that do not use laser vision sensors but use data from voltage and current waveform measurements to monitor the generation of back-beads. Kim et al. proposed a system that uses DNN to determine the generation of back-beads21). They measured the current and voltage generated when GMA welding was performed for butt welding of galvanized steel plates and trained a DNN based on the obtained information. As a result, when there were five hidden layers with 23 nodes in the deep neural network structure, the system determined the generation of back-beads with the highest accuracy of 96.91%, which was about 25% higher than when tested after training with an artificial neural network structure. Jin et al. developed a back-bead prediction model for GMA welding based on a convolutional neural network (CNN) model22). By performing Morlet wavelet transform on the measured welding current in the short-circuit transformation mode of the GMA welding process, scalogram-based feature image data were obtained and analyzed to predict the quality through the CNN model. The prediction accuracy was approximately 93.5%.
3. Conclusion
Arc welding quality monitoring is a technology that uses various sensors and techniques such as camera sensors, process parameters (welding current and voltage) sensing, laser-based sensors, and machine learning to analyze and predict weld quality such as weld appearance, defects, and mechanical properties. In this review paper, we introduced the recent development trends of arc welding quality monitoring technology in South Korea. Although we have described the trends of the technology using the classification criteria of each technique, there are cases where process monitoring is performed by applying multiple monitoring techniques and prediction models to improve the accuracy of weld quality monitoring, rather than using only one technique as described. Monitoring technology is showing high accuracy in predicting weld quality owing to the development of various sensors and analysis methods. It is expected that the demand and importance of weld quality monitoring will increase to ensure the reliability of welds.
Acknowledgments
This research was supported by the Korea Institute of Industrial Technology (KITECH) under one of its major projects, “Development of Smart Welding System Modules with Dynamic Variable Control for Full Penetration Weld (KITECH EH-23-0007).