Study on the Microstructure and Mechanical Properties of Butt GMAW Al/Fe Dissimilar Joints using Pure Copper Filler Metal
Article information

Abstract
The automobile industry is required to reduce the automotive exhaust emissions and enhance fuel efficiency by reducing the weight of the vehicle body (lightweight body) and increasing the strength of the vehicle. To manufacture a lightweight body, there have been numerous studies on Al/Fe dissimilar joining globally. However, the biggest problem of those studies was the formation of the Al-Fe intermetallic compound (IMC) layer, which broke the weld metal on the Al-Fe IMC layer. Therefore, in this study, Al/Fe dissimilar joining using gas metal arc welding using pure copper (Cu) filler metal was proposed to solve the aforementioned issues. As the travel speed increased 5 to 9 mm/s, the temperature gradient and crystal cooling rate increased. This made the Al-Cu Eutectic and Hypereutectic Zone to be narrow and dendrite α-Al Zone to be wide in the Al-based weld zone (Weld Zone II). From the travel speed of 8 mm/s, the hardness at the Weld Zone II is lower than the under the travel of 7 mm/s. The tensile test results for fracture was observed in the Al base metal.
1. Introduction
As the joining Carbon Neutrality begins in world wide, almost country try to solve the environmental problems and enforce the environmental regulations. Accordingly, the automobile industry is inevitably required to reduce vehicle exhaust gas emissions and enhance fuel efficiency by reducing the weight of the vehicle body and increasing the strength of parts. Vehicle fuel efficiency improvement technology can be divided into three categories: body weight reduction technology, reduction of driving resistance and improvement of engine and drive system efficiency. Among them, the body weight reduction technology has great advantages of economy and short application cycle. Aluminum, which is a representative lightweight material, can be used as a material for weight reduction of the vehicle body and the usage range of aluminum on automobile was expanded1). There has been a trend that steel and aluminum are compositely composed as body materials, and for the stabilization of development, it is essential to secure a technology for joining different materials between steel and aluminum. However, there are many difficulties for Al/Fe joining. Aluminum and steel are insoluble and have different chemical and physical properties(specific gravity, melting point, thermal conductivity, coefficient of thermal expansion). Also, according to the content of Fe and Al, and as the ratio of Al increased, various brittle Fe-Al intermetallic compounds are generated. Therefore, it is essential to minimize the formation of the intermetallic compound layer by selecting and appropriate process method and process parameters for joining aluminum and steel dissimilar materials2,3). H.T Zhang et al. investigated the thickness and formation mechanism of the Fe-Al intermetallic compound formed at the steel interface when brazing aluminum alloy and galvanized steel sheet by CMT welding using Al-Si filler metal according to the amount of heat input4). S. M. Cho et al. investigated the polarity effect of the brazing joint of cold rolled steel(SPHC) and galvanized sheet steel(EG) using AC pulse MIG welding with polarity mask, and bonding characteristics according to EN polarity ratio. They reported that a high-quality joint was obtained during arc brazing using Cu-Al and Si-Al filler wire, and as the EN polarity ratio increased at the same wire feeding speed,(the amount of heat input to the base metal decreased and the deformation decreased) proper strength value was obtained5).
It can be confirmed that, in the Fe-Cu binary system, there are no Fe-Cu intermetallic compounds6,7). Based on this, the idea of using pure copper filler metal for dissimilar welding of aluminum and steel was obtained in the study. Therefore, in this study, dissimilar welding of aluminum and steel was tried to reduce the weight of the car body and attempted to minimize the formation of intermetallic compounds by using pure copper filler metal. In addition, as a welding method, GMAW(Gas Metal Arc Welding) was used because of its advantage of the automatically feeding filler wire to feed it regulary. After GMAW, it was confirmed whether the joints was well achieved by observing the bead and weld formation. Also the microstructure was observed to confirm the structure of the molten base metal and the filler metal and the formation of intermetallic compounds. In addition, the mechanical properties of the weld were confirmed by performing a mechanical property test at room temperature. Through this, the suitability and feasibility of aluminum and steel dissimilar welding technology for future automobile body weight reduction was confirmed.
2. Materials and Methods
2.1 Materials
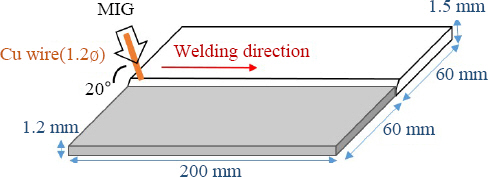
The plate aluminum base metal used in this study is pure 1050 aluminum with a thickness of 1.5mm, and is shown in Fig. 1 As shown in the cross section of the specimen, the aluminum base metal was processed by 45° groove-cutting to about 1/2 of the thickness8) for well precipitation of molten Cu and Fe and protect from overprecipitation of Al on the joint. The plate steel base metal is 1180MPa high-strength steel which has no plating layer with a thickness of 1.2mm, and the chemical composition of the two base metals is shown in Table 1. The base metal was machined to 200×60×t mm. In addition, for the wire filler metal used in GMAW, pure copper filler metal with a diameter of 1.2∅ was used.

Cross-Sectional diagram of AA1050-1180MPa high-strength steel butt GMAW process

Chemical composition of AA1050 and 1180MPa high-strength steel base metals
2.2 GMAW process
The pulse GMAW process is shown in Fig. 2. As shown in the schematic diagram in Fig. 2, based on the torch position and welding start direction, 1180MPa high-strength steel sheet was placed on the left side, and AA1050 aluminum sheet was placed on the right side for butt joint. Those two base metals were fixed by using jog at the edge of both base metals. There is 0.3mm gap between two base metals for well precipitation of molten Al, Cu, Fe on the joint and protect from too much high height of bead shape because of the big difference of melting point between Al and Cu, Fe. The used welding equipment was the VR4000 model from Frounius, and it was automated using a robot from YASKAWA. The welding torch angle was fixed at an advance angle of 20°, CTWD(Contact Tip to Work Distance) was 12mm, and Argon gas flow rate was 10-15L/min. The only variable was the travel speed; 5, 7, 8, 8.5, 9mm/s(6mm/s specimen was broken as soon as the welding finished). The welding conditions are shown in Table 2.
Schematic diagram of AA1050-1180MPa high- strength steel butt GMAW process

Welding conditions of AA1050-1180MPa highstrength steel butt GMAW
2.3 Microstructure and component analysis
After GMAW, the welds were cut to observe the shape and microstructure of the welded part and analyzed for components. The specimens were pretreated in the order of hot mounting, grinding, and polishing.
After hot mounting, SiC abrasive paper #800~#4000 was used to grind in order, and for fine grinding, diamond suspension 3um, 1um, and colloidal silica 0.025um was used for polishing in order.
After the pre-treatment, HITACHI’s Scanning Electron Microscope(SEM) TM3030 model was used for shape and microstructure of welded part and Fe-SEM/EDS S- 4800 model was used for checking chemical component analysis.
2.4 Mechanical properties test
In order to confirm the hardness tendency of the welded specimens by various travel speed, the Vickers microhardness was measured in the horizontal direction from the high-strength steel base metal to the aluminum base metal through MMT-X7B Vickers hardness tester from MATSUZAWA. The load was set differently, and 500gf was applied in the vicinity of the high-strength steel base metal and in the Cu-based weld zone(Weld Zone I) and the vicinity of the aluminum base matal was set to 100~300gf. The specimen was divided into the upper, middle, bottom parts in the horizontal direction, and each part was measured 5 times at intervals of 0.3 to 0.5 mm. When preparing a hardness graph according to the distance form the interface of the molten part, the similar hardness value parts were averaged and the parts were measured at 1 mm intervals. It is expressed as an average hardness value.
In order to confirm the tendency of tensile strength and elongation for each welding speed of the welded specimens, a tensile test specimen was prepared in accordance with ASTM-E8 standard. A tensile test at room temperature was performed at a strain rate of 0.0025mm/s using Shimadzu’s Univeral Testing Machine AGS-X(100kN) tensile tester. The specimen for tensile test used ASTM-E8 standard, with a total length of 100mm, a gage length of 25mm, and a width of 6mm.
3. Results and discussion
3.1 Bead and Weld shapes
Fig. 3 shows the bead shapes after AA1050-1180MPa butt GMAW process for each travel speed(5, 7, 8, 8.5, 9 mm/s) using pure copper filler metal.
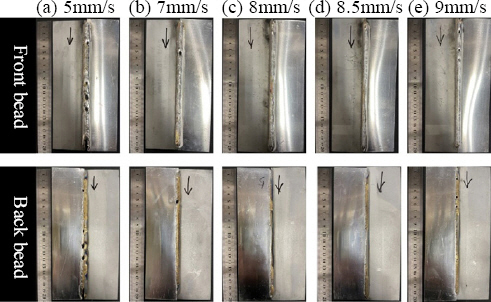
Bead shapes for whole travel speed specimen; (a) 5mm/s, (b) 7mm/s, (c) 8mm/s, (d) 8.5mm/s, (e) 9mm/s
Equation (1) shows the welding heat input(Q). V is the welding voltage, I is the welding current, and k is the welding efficiency. It can be seen that the amount of heat input decreases as the travel speed value increases9). Accordingly, (a) the 5mm/s specimen has more heat input than over 7mm/s specimen when remaining welding conditions are the same. Therefore, it can be confirmed that the (a) 5mm/s specimen has a wider bead width and lots of melted pure copper filler metal on the back bead as the base metal and filler metal melted more than relatively (b) 7mm/s or more specimens. And also there were many relatively large pores compared to the specimens of (b)7mm/s or more, and the width of the bead was wide at the beginning of welding, thinned in the middle, and then widened again at the end, showing an inconsistent appearance. The size of pores did not decrease or even occur from specimens of 7mm/s or more, the bead width was formed uniformly and stabilized, and the pure copper filler metal was sufficiently welded to the back bead in a certain amount.
Fig. 4 shows the weld shapes after AA1050-1180MPa butt GMAW process for each travel speed(5, 7, 8, 8.5, 9 mm/s) using pure copper filler metal. The weld shape was the same in all specimens, the high-strength steel base metal hardly melted, and the aluminum base metal and pure copper filler metal were melted to form a weld zone. The yellow dotted line indicates the molten aluminum base metal, and the blue dotted line indicates the molten high-strength steel base metal. Among the parts indicated by the white solid line, the left part is the Cu-based melting zone(Weld Zone I) where Cu melted from pure copper filler metal is the main component, and the right part is the Al melted from the aluminum base metal as the main ingredient. It is an Al-based melt zone(Weld Zone II). Since the amount of heat input decreases as the travel speed increases, the height of the bead is the highest in the (a) 5mm/s specimen, and the (b)~(d) specimens are similar. It can be seen that the amount of molten Cu under the high- strength steel base metal is larger than that of the (b) 7mm/s specimen to the (a) 5mm/s specimen.

Weld shapes for whole travel speed specimen; (a) 5mm/s, (b) 7mm/s, (c) 8mm/s, (d) 8.5mm/s, (e) 9mm/s
Equation (2) shows crystal growth rate(R) and correlation between the travel speed(S) and the vector angle value of the travel speed and the crystal growth rate(COSθ). θ is angle between solidification growth direction and welding direction. The θ value on the top side of joint is always smaller than bottom side and COSθ value on the top side of joint is bigger than bottom side, resulting in a high crystal growth rate R value on the top side of joint10,11). And also, Therefore, it can be considered that the crystal growth rate of the molten portion increases as the travel speed increases, and in particular, in overlap welding, it can be inferred that the crystal growth rate increases as it goes to the upper and end of the molten portion in contact with the arc heat. Therefore, the faster travel speed, the faster the crystal growth rate. At this time, it is judged that the upper part of the bead which is close to the fusion line solidifies quickly.
In addition, it can be seen that the specimens of 7mm/s or less had many pores in the upper-middle part of the Weld Zone II, and the specimens of 8mm/s or less had many pores in the lower part of the weld zone. It is thought that the interface shape of Weld Zone I & ii was created in the form of a curve rather than a straight line due to the difference in melting point and specific gravity. However, it was predicted that the melting amount would decrease due to the decrease in the heat input according to the increase in the travel speed, but it was confirmed that the melting amount of the high-strength steel base metal did not match the predicted one. This is considered to be an experimental error caused by the instability of the position where the arc was received as the welding part moved by welding with loose fasten jog between the two base metals, even though the base metals was completely fastened before starting welding.
3.2 Microstructure of weld zone
Fig. 5 shows the microstructure of small amount of molten Fe part on 1180MPa high-strength steel base metal side at each travel speed.

Microstructure of melted high-strength steel base metal area for whole travel speed specimen; (a) 5mm/s, (b) 7mm/s, (c) 8mm/s, (d) 8.5mm/s, (e) 9mm/s
In the microstructure (a) 5mm/s specimen to (e) 9mm/s, the lower left part is the high-strength steel base material, and the right middle-upper part is the microstructure of the high-strength steel base metal melted in small amounts. It can be seen that primary ferrite(α-Fe) is precipitated in the shape of a black dot in the Cu matrix. As the travel speed increases, it is considered that the cooling rate value increases, and the temperature gradient at the top of the molten part in contact with the arc is relatively low10,11). Therefore, it can be confirmed that a supercooled dendrite α-Fe structure is formed. Although the amount of heat input would be decreased as the travel speed increased, the amount of molten Fe from steel base metal did not follow the trend of decreasing. This is considered to be experimental error in the welding process such as loose combination of base metals from loose jog.
There can be seen that a black band is formed between the Cu matrix and the high-strength steel base metal, which is considered to be an interdiffusion layer formed by the reaction of liquid Cu with solid Fe. In addition, except for α-Fe precipitated in the Cu matrix, a dark gray phase was formed. As a result of examining the components of the specimen (b) phase through EDS, Al:21.48, Fe:12.37, Cu:66.15(at. %). When looking at the Cu-Al-Fe equilibrium diagram, it can be confirmed that two phase parts and three phase parts exist in a part with a high Cu content in low Al and Fe content12). The components of the dark gray phases are Al:30.39, Fe:5.33, Cu:64.28(at. %)13). Therefore, it is judged that the microstructure of the part where the high-strength steel base metal is melted in a small amount is precipitation of primary ferrite(α-Fe) and Al-Cu intermetallic compound(Al4Cu9), which is a dark gray phase in the Cu matrix14).
Fig. 6 shows the microstructure of the Cu-based weld zone(Weld Zone I) as increasing the travel speed. The large amount of Cu is melted from pure copper filler metal. In Weld Zone I, it can be confirmed that α-Fe was precipitated in the shape of a black dot in the Cu matrix like the molten part of the high-strength steel base metal in Fig. 5 It can be confirmed that a supercooled dendrite α-Fe structure is formed because as travel speed increases, the temperature gradient is low at upper weld zone which is contacted to arc. Also, due to experimental errors, it can be seen that although the amount of heat input decreased as the travel speed increased, the amount of molten Fe from high-strength steel did not follow the tendency to decrease. As a result of examining the dark gray phase in Weld Zone I through EDS, in (b) 7mm/s specimen was Al:20.34, Fe:6.60, Cu:73.06(at. %). Compared to the high-strength steel base metal melting part(Fig. 5), since the pure copper filler metal is close to the melting point, the diffusion rate of the element is different, so the Fe content decreases and the Cu content increases. Therefore, it can be seen that primary ferrite(α-Fe) and Al-Cu intermetallic compound(Al4Cu9), which is a dark gray phase, were precipitated on the Cu matrix.
Microstructure of Weld Zone I for whole travel speed specimen; (a) 5mm/s, (b) 7mm/s, (c) 8mm/s, (d) 8.5mm/s, (e) 9mm/s
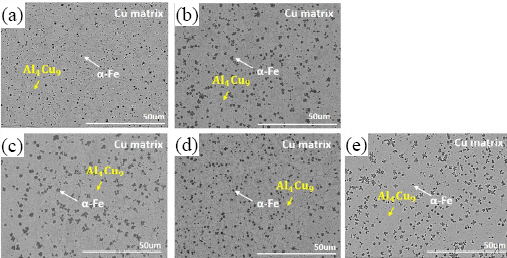
Fig. 7 shows the representative microstructure of the Al-based weld zone(Weld Zone II). In Weld Zone II, different organizations appeared in three main areas. The upper part is a region in which primary aluminum(α-Al) is precipitated in the Al-Cu eutectic matrix generated by the reaction of molten Al from the aluminum base metal and molten Cu from the pure copper filler metal(α-Al Zone). From the middle part, the bottom side of weld zone has large temperature gradient than the top side and the crystal growth rate is slow, so the content of Cu is relatively increased at bottom side of weld zone. Accordingly, the middle part formed an Al-Cu eutectic zone(Eutectic Zone) in which primary Al2Cu, which is an Al-Cu eutectic matrix, was cellularly precipitated on the Al-Cu eutectic matrix. In the lower part, because the Cu content is fturther increased, the temperature gradient is high, and the crystal growth rate is slow, the matrix phase Al2Cu is formed in a planar form, and the hypereutectic structure AlCu is partially precipitated and form an Al-Cu hyepreutectic zone(Hypereutectic Zone). In Weld Zone II, as the travel speed increases, the θ value in Equation (2) becomes smaller and the COSθ value increases and the crystal growth rate is increased as a result. The Al atoms located at the top side relatively close to the fusion line expand the area where the Al atoms solidify due to the influence of the low temperature gradient and fast crystal growth rate. Therefore, Fig. 8 shows the tendency where the α-Al zone becomes wider and on the contrary, the Eutectic Zone and Hypereutectic Zone becomes narrow although the experimental error of loose fasten with jog as mentioned in 3.2. This is considered that the effect of direct arc on joint makes neutralize the experimental error which is loose fasten of jog on base metals.

Representative microstructure of weld zone II

Microstructure of Weld Zone II for whole travel speed specimen; (a) 5mm/s, (b) 7mm/s, (c) 8mm/s, (d) 8.5mm/s, (e) 9mm/s
Fig. 9 summarizes the phases verified by performing EDS component inspection on α-Al, Al-Cu eutectic structure, and Al-Cu hypereutectic structure in Weld Zone II. It can be seen that the Cu content increases toward the lower end.
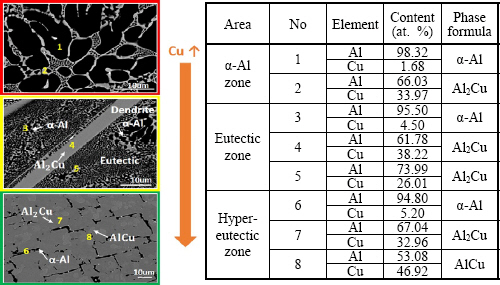
Chemical compositions of phases in weld zone II
3.3 Mechanical properties
Fig. 10 shows Vickers hardness test results of AA1050 aluminum and 1180MPa high-strength steel dissimilar butt GMAW joints by increasing travel speed using pure copper filler metal. The x-axis of the Vickers hardness test result graph represents the distance from the Weld Zone I and Weld Zone II interfaces, and the y-axis represents the fine Vickers hardness value.
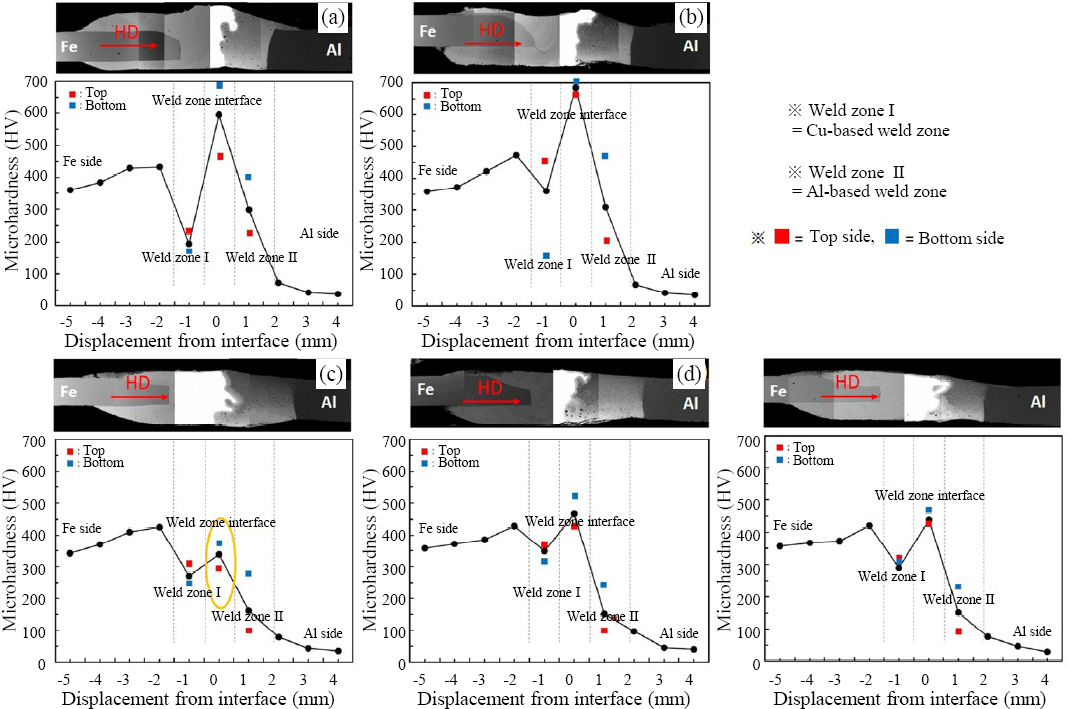
Schematic diagram of horizontal direction for the hardness measurement for whole travel speed specimen; (a) 5mm/s, (b) 7mm/s, (c) 8mm/s, (d) 8.5mm/s, (e) 9mm/s
The Vickers hardness was measured by diving the specimen from the high-strength steel base metal to AA1050 aluminum base metal into the top, middle, bottom parts in the horizontal direction of the specimen. In the Fig. 10, if the difference in hardness between the top, middle, bottom part was within 5HV, the average value was calculated and indicated by a black solid line. If the hardness difference was greater than 10HV, the top part was indicated by a red dot and the bottom part by a blue dot. It can be seen that the hardness value is very high at the interface of Weld Zone I and ii up to the specimen of 7mm/s or less, and the hardness value is significantly lowered in the corresponding part from the specimen of 8mm/s or more. This is due to the increase in the crystal growth rate according to the increase in travel speed. It is judged that this is a phenomenon that occurs as the α-Al Zone content increases, and the precipitation of brittle Al-Cu eutectic and hypereutectic structure decreases.
Fig. 12 shows the tensile test results of AA1050 aluminum and 1180MPa high-strength steel dissimilar butt GMAW joints by increasing travel speed using pure copper filler metal. It can be seen that the 5mm/s and 7mm/s specimens did not undergo plastic deformation, but immediately brittle fracture. On the other hand, in the 8, 8.5, 9mm/s specimens, plastic deformation occurred as a neck was created, and the each UTS and elongation were 86MPa/15.3%, 86MPa/13.2%, 75MPa/ 14.1%, which was similar to the mechanical properties of aluminum base metal(60-100MPa/15-28%15,16)). As shown in Fig. 11, 5mm/s and 7mm/s specimens are fractured between the Weld Zone II and the aluminum base metal. In the hardness data of 5mm/s and 7mm/s specimens, the hardness values at the Weld Zone I & ii interfaces were very high(600-700HV), so it was expected that fracture would occur at this interface. However, the fracture occurred between Weld Zone II and AA1050 aluminum base metal. This is considered to be due to the formation of high hardness value Al-Cu eutectic structure Al2Cu and hypereutectic structure AlCu(Al2Cu:324HV, AlCu:628HV15,16)). Based on the above-mentioned contents, due to the relationship between crystal growth rate and travel speed, the α-Al Zone range expands to the middle-bottom part of the weld zone, and at the same time, the Eutectic and Hypereutectic Zones narrow, and content of ductile Al atoms increases from 8mm/s or more specimen. Therefore, due to these phenomenon, it is judged that the 8, 8.5, 9mm/s specimens were fractured at the aluminum base metal and able to be avoid fracture at eutectic and hypereutectic area which have high hardness values.

(a) Travel speed-UTS (b) Travel speed-Elongation

Tensile test specimen for whole travel speed specimen; from the top 5-9mm/s
4. Conclusion
After AA1050-1180MPa high-strength steel butt GMAW, the effect of pure copper filler metal and the optimal welding process were derived by observing the microstructure of the joint by travel speed, inspecting chemical components, and evaluating mechanical properties, and the following conclusions were obtained.
1) As the travel speed value increased, the crystal growth rate value is increased. This makes the α-Al Zone to be wider and Eutectic & Hypereutectic Zone to be narrow in Weld Zone II.
2) Because of the 1), the Vickers hardness of Weld Zone I which contains ductile Al content is lower than high-strength steel base metal, Weld Zone II which contains Al-Cu eutectic & hypereutectic structure is lower than AA1050 aluminum base metal, and the Weld Zone I & ii interface which is contains concentrated eutectic & hypereutectic structure is highest among the all parts of each specimens.
3) Because of the 1), 8mm/s or more specimens had plastic deformation with necking and occurred the fracture on aluminum base metal. In this study, the biggest problem of Al/Fe dissimilar welding where the fracture occurred on Al-Fe intermetallic compound layer was not occurred.
4) The optimum process of AA1050-1180MPa High- strength steel is 0.3mm gap between two base metals, groove-cutting on aluminum base metal and travel speed 8mm/s. In order to obtain a good quality joint, it is considered that it is necessary to precipitate Al sufficiently in Weld Zone I to make it ductile, and to reduce the range of Eutectic & Hypereutectic Zone in Weld Zone II.