


1. Introduction
Additive Manufacturing (AM) has been widely promoted over the past two decades for the fabrication of complex parts with high value. Although issues related to reliability, cost effectiveness and reproducibility are still matter of concerns, the outstanding potential of AM and its many different technologies is undeniable1-10). For manufacturing metallic products in particular, AM offers a freedom in design complexity and customization unmatched by conventional manufacturing processes.
Powder bed fusion (PBF) and directed energy deposition (DED) as defined by ASTM International decidedly emerged as the preferred approaches for many applications11-15). PBF processes such as Selective Laser Melting/Sintering (SLM/SLS) and Electron Beam Melting (EBM) offer outstanding opportunities in terms of complex design versatility and materials properties. PBF technologies involve the precise deposition of a pre-alloyed powder layer which is selectively melted or sintered according to the CAD profile by the power source in an inert environment. The building platform is subsequently lowered by one layer thickness and the process is repeated until the entire part(s) has/have been built. The successful production of high quality parts depends on the optimization of the several process parameters. PBF processes and SLM in particular have been extensively studied in recent years all over the world especially for applications in the fields of automobile, aerospace, tooling and medical. A wide range of materials with outstanding properties have been produced such as superalloys16-23), steels24,25), Al alloys26-30), Ti alloys31-35), CoCr-Mo alloys36-39), etc. For the most part, optimization of the process consists in determining the appropriate set of parameters in order to produce parts with the highest possible density, which has often been measured well over 99 %16-19,21,24,26,28,32,33).
For the SLM process itself, many parameters have to be taken into consideration. For a given equipment, the parameters with the most influence are typically: the layer thickness, the hatch spacing, the scanning speed, the laser power, the scanning strategy, and the protective gas environment inside the building chamber. Although the optimization campaign is well known to researchers and industrials familiar with AM processes, there are to our knowledge no published articles focusing solely on this approach to serve as a guide for SLM, and more generally AM, process optimization. This is the scope of the present paper to clearly define the process parameters and their influence, and more importantly to fully describe the optimization campaign for SLM processing. In the present report, we focused on the optimization method for SLM processing. This typically follows the response surface methodology (RSM) which consists in varying process parameters and recording a response40-42). This versatile method is described in details and opportunely illustrated for a CoCr-Mo alloy. It allowed to define an optimum processing window for the reliable production of dense parts.
2. Materials and Method
2.1 SLM equipment
The SLM apparatus used for the present study was a METALSYS 150 produced by the Korean company Winforsys Information Technology Co., Ltd. (http://www.winforsys.com/). This machine is equipped with a 200 W Yb-fiber laser with a wavelength of 1.075 ╬╝m. The beam spot is approximately 70~150 ╬╝m, and the travel speed reaches 7 m.s-1. The building volume for this small equipment is 150x150x150 mm3 under Nitrogen or Argon atmosphere and the temperature within the chamber can be regulated up to 80 ┬░C.
Metal powder layers are formed by a raking mechanism. The powder is fed from the hoppers and precisely spread onto the building platform by a silicon blade. Typically, the layer thickness is in the range 20 to 100 ╬╝m with a high precision of ┬▒ 3 ╬╝m. The laser beam scans over the powder layer and selectively melts the powder into solid and dense metal according to the CAD model. The building platform is then lowered by one layer thickness, a new layer of powder is deposited and the melting process is repeated to build the parts layer-by-layer. The whole process takes place under inert atmosphere, typically an Ar flow, to avoid oxidation and impurities pick-up. When all layers have been processed, the parts rest inside the chamber and can be removed from the powder bed. The parts can subsequently be washed and separated from the building platform which is reused after slight machining. The unprocessed powder can easily be disintegrated, sieved, and inserted again in the SLM machine to be reused in the next build thanks to very low impurities pick-up, therefore material waste is very limited.
2.2 SLM process optimization
The systematic approach for optimizing the SLM process consists in determining the most suitable set(s) of parameters for a given material. SLM can be assimilated to a micro-welding process, in which parts are consolidated by successfully joining powder tracks melted by the laser both in the layer plane and the building direction normal to the layer plane. Therefore, the success of the process essentially resides in the appropriate melting and consolidation of the welding tracks. For a given equipment, the parameters with the most influence are typically: the layer thickness t corresponding to each layer, the hatch spacing h corresponding to the distance between two adjacent scanning tracks within a layer, the scanning speed ╬Į corresponding to the scanning speed of the laser tracks, the laser power P, the scanning strategy corresponding to the overall path followed by the laser during selective melting of the powder, and the protective gas environment inside the building chamber. The amount of energy for melting at a given point is conventionally described by the energy density Ed (J.mm-3)
Where P is the laser power in W, ╬Į is the laser scanning speed in mm.s-1, t is the layer thickness in ╬╝m and h is the hatch spacing in ╬╝m. From Eq. (1), a small variation of the principal process parameters values significantly influence the energy density. Besides, same values of energy density are possible with very different parameters values, for example the couple P/╬Į.
For this reason, an approach based on the response surface methodology (RSM) is usually preferred to investigate the effect of the different process parameters and determining the appropriate set of parameters for a given alloy40-42). This empirical method is commonly used for processes to optimize a response influenced by several independent variables, here the process parameters aforementioned. Based on the RSM, the optimization campaign consists in defining matrices and building samples simultaneously using different sets of parameters. The layer thickness t should be determined according to several factors. The layer thickness evidently affects the parts building time. It is therefore convenient to maximize the layer thickness, sometimes at the expense of definition, in order to maximize production rates usually much lower compared to conventional manufacturing. The layer thickness is however dictated by the melt pool geometry, depth or penetration in particular. The pre-alloyed powders size is also an important limiting factor, principally on the lower bond. The successive deposition of powder layers and their consolidation suggest remelting of underlying material. As it will be discussed later in section 3.3, this is usually accompanied by epitaxial solidification and evidenced by columnar microstructures with elongated grains in the building direction intercepting several layers. The melt pool geometry depends on the laser power P, the scanning speed ╬Į and the scanning strategy, as well as the alloyŌĆÖs thermal properties. Obviously, the layer thickness canŌĆÖt be varied from one sample to another during a single process. The hatch spacing h should similarly be determined according to the melt pool geometry. Sufficient overlapping of adjacent melt tracks, preferably between 20 and 30 %, is necessary to insure appropriate consolidation. Valuable information about the melt pool geometry can be obtained by studying single-line scanning and analyzing the melt pool geometry, using a similar approach as described in the present paper varying P and ╬Į in particular. The scanning strategy describes the laser scanning sequence and is normally decided by the operator. Several approaches have been studied and have shown to significantly influence the residual stress and grain structure of as-built part: linear, circular, in-out, out-in, stripes, island, etc. Example of studies of the effect of the scanning strategy can be found in the literature,24,43-45). These studies show that the scanning strategy particularly influences the heat history of the built part. The laser power P directly affects the quantity of heat energy locally received by the powder bed for melting. The power must therefore be adjusted to provide sufficient heat for melting together with avoiding an excess of heat which could lead to partial volatilization of certain elements or sputtering of the powder. This obviously depends of the thermal characteristics of the material being processed. Finally, the scanning speed strongly effects the solidification as the faster the scanning speed the faster the solidification speed. More generally, the scanning speed determines the time at which the power source stays in the vicinity of a given point of the powder layer of the consolidated part. This in turn influences again the heat history of the as-built parts with direct impact on their performances.
According to the RSM, the process parameters are given different values and varied independently. Several models have been developed for experimental designs which have been described in detail in the literature40,41). Central composite designs in particular are particularly effective for SLM process parameters optimization. This allows studying five levels, or values, for each parameter. As implied in its name, the RSM requires recoding one or several response(s). These experimental data are fitted using mathematical and statistical technics and typically represented using 2D or 3D-contour maps therefore illustrating optimal processing windows. For SLM optimization, several responses can be considered: density and/or porosity; microstructure; macroscopic defects such as cracks, distortion and roughness; residual stress; etc. In practice, optimization of the SLM process for a given alloy on a given machine should be carried out in different steps. First trials consist in a rough optimization for avoiding macroscopic defects such as cracks, distortion and excessive roughness. This basically ensures that the as-built parts geometry is consistent with the design with no visible defects. In a second step, the process parameters should be optimized to minimize porosity. This is a great asset of the SLM process to be able to produce fully dense parts with virtually no residual porosity. Optimization of the process parameters towards low residual porosity, typically lower than 1 % although very low porosity below 0.1 % is often possible, is a necessary condition for production of high quality parts and products by SLM. Finally, finer optimization can and should be carried out with consideration of microstructure and residual stress to improve the mechanical properties of as-built parts. The above description highlights the complexity of the SLM process, for which numerous parameters need to be optimized within a narrow processing window allowing production of high quality parts.
2.3 Materials
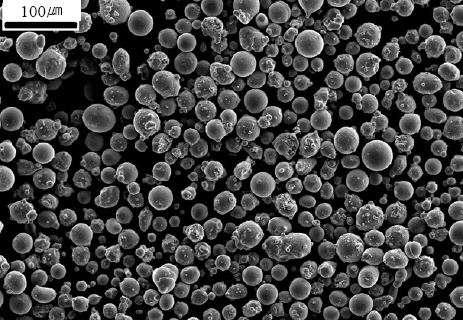
To illustrate the optimization method described in the previous section 2.2, a CoCr-Mo alloy (CoCr) was used in the present study. This allowed to clearly illustrate the efficacy of the method. CoCr-Mo alloys are extensively used in the medical and dental fields due to high strength and stiffness together with good wear and environmental resistance. Applications in aerospace are also common for these alloys. The use of AM and SLM in particular is decidedly sound as it allows high level of complexity and customization. Pre-alloyed powders specifically designed for AM were used, supplied by Sandvik Osprey Ltd. The pre-alloyed powders characteristics are given in Table 1 according to the supplier. The powders were typically mostly spherical, with a Gaussian particle distribution between 10 and 45 ╬╝m, produced by the gas atomization process (Nitrogen gas). The morphology of the powders was observed by scanning electron microscopy (SEM) as displayed in Fig. 1 and the composition was approximately confirmed by energy dispersive spectroscopy (EDS).
Table┬Ā1
CoCr-Mo powders characteristics
| Measured | ASTM F7546) | |||
|---|---|---|---|---|
| Min. | Max. | |||
| Chemical composition (wt.%) | Cr | 28.7 | 27 | 30 |
| Mo | 6.1 | 5 | 7 | |
| Mn | 0.69 | - | 1 | |
| Si | 0.68 | - | 1 | |
| C | 0.25 | - | 0.35 | |
| Fe | 0.18 | - | 0.75 | |
| Ni | 0.01 | - | 0.5 | |
| Co | Bal. | - | Bal. | |
| Particle size (╬╝m) | d Ōēż 10 | 3.6 % | ||
| 10ŌēżdŌēż45 | 96.3 % | |||
| Ōēź 45 | 3.6 % | |||
| Tap density (g.cm-3) | 5.1 | |||
2.4 Case study: optimization for the studied alloys
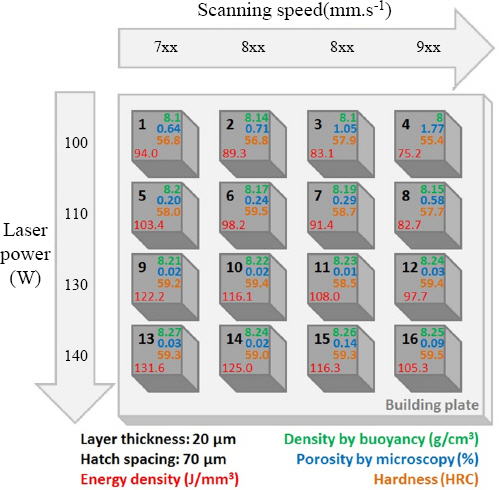
The scope of the present paper is to describe the methodology for optimization and the value of this approach for successful production of high quality parts. For this reason, the case study was kept relatively simple and constitutes more of a guide line for optimization rather than a definite optimization campaign. Any optimization approach should begin with a thorough literature review. The popularization of the SLM processing of relevant materials over the past decade provides the scientific community with a plethora of published research on the production of alloys, conventional or not. Nevertheless, as mentioned earlier, the influence of a specific equipment and specific powders is non negligible, so that an optimization campaign such as that described in the present article is strongly advised. Here, the strategy was to minimize residual porosity, the so-called response of the RSM. Not only the porosity was measured as described later in section 2.5, the microstructure and hardness of the produced specimens were also analyzed. The method was based on a simplified version of the RSM: the hatch spacing (h = 70 ╬╝m) and the layer thickness (t = 20 ╬╝m) were appropriately studied previously and kept constant, while the laser power (100, 110, 130 and 140 W) and scanning speed (7xx, 8xx, 8xx, 9xx mm.s-1) were varied. The actual scanning speeds are not detailed for proprietary con- siderations. The scanning strategy chosen was an island scanning with an island size of 5.4 mm and a rotation angle of 67┬░ between layers. A matrix of sixteen 1 cm3 cubes was therefore produced on a single building plate. The schematic design of the experimental procedure is given in Fig. 2. In Fig. 2, the calculated values of energy density Ed according to equation 1 were included in red.
Fig.┬Ā2
Schematic of the experimental design used for process parameters optimization for the production of the CoCr-Mo alloy by SLM. The layer thickness and the hatch spacing were kept constant. The scanning speed and the laser power have been varied. The corresponding values of energy density Ed according to Eq. (1) are given in red. The values of density Žüs measured by buoyancy method according to Eq. (2) are given in green. The values of porosity P% measured by microscopy according to Eq. (3) are given in blue. The values of Brinell hardness are given in orange
After the production of the sample by SLM according to the matrix design in Fig. 2, the samples were removed from the building platform by means of wire cutting for analysis. The response chosen for optimization as per the RSM was the residual porosity. As previously mentioned, porosity is critical for AM parts and should be as low as possible. Note here that minimizing porosity or maximizing density is equivalent. There are several methods for measuring porosity47): buoyancy method (ArchimedesŌĆÖ principle), optical microscopy (micrograph of cross sections) and X-rays (CT scan). X-ray scanning is a non-destructive technic which allows not only quantifying porosity but also to visually observe porosity all over specimens. It is however not readily available as it requires costly equipment, it is a time-consuming measure and often suffers from definition not allowing detection of very fine pores smaller than 10 ╬╝m. On the other hand, both buoyancy and microscopic methods are fairly easy.
The buoyancy method, also referred to as ArchimedesŌĆÖ principle, consists in calculating the density of a sample by measuring the mass of the sample in air and immerged in a liquid of known density using a high precision balance. The density of the sample Žüs (in g.cm-3) can easily be calculated according to the following equation:
Where ma is the mass of the sample in air (g), mi is the mass of the sample into the liquid (g) and Žüi is the density of the liquid (g.cm-3). For more simplicity, the liquid is often water and its density is taken as Žüi = 1 g.cm-3 regardless of temperature. Also note that in Eq. (2), the buoyancy of the sample in air is not taken into account as the density of air is assumed Žüair = 0 g.cm-3. For more precision, acetone could be used instead of water, the ambient and the temperature of the liquid can be carefully monitored (as density depends on temperature). However, the approximations described above are usually satisfactory for most investigation. This buoyancy method is non-destructive, can be applied to any sample or part geometry and does not require any specific equipment other than a precision balance and an appropriate density kit. Another significant advantage of this method is that it considers the porosity of the entire part as opposed to the microscopic method described next. An inconvenient limitation however is that it does not give any information of the porosity itself in the sense that it gives no information about the morphology, size and location of pores. These are however important information to understand the nature of porosity: powder or process porosity, inconsistent layer interfaces, inconsistent island boundaries, inappropriate hatch spacing, etc. Another limitation is that it is usually difficult to correlate the measured density to actual residual porosity. The only way to do so would be to compare the actual measured values of density to the theoretical density of the sample. However, in a complex alloy system with several alloying elements and phases, a precise evaluation of the theoretical density is not readily available.
The microscopic method consists in sectioning the samples which, after conventional metallographic preparation, allows direct observation of the porosity by optical microscopy. The section of the samples are conveniently mounted, ground and polished to obtain a flat highly reflective surface. The white light of the optical microscope is therefore reflected except at pores which thus clearly appear as dark surfaces. The amount of porosity P% (in %) can therefore be easily computed by:
Where ╬Ż Apores is the sum of the area of each individual pore and Asmmple is the total area of the sampleŌĆÖs cross section. This method has several advantages: it is again rather simple and does not require specific equipment other than standard metallurgist equipment, and more importantly it allows direct observation of porosity. Accordingly, porosity can easily be quantified in terms of volume fraction but also the aspect ratio, size and position of pores. This is often necessary to assess the cause of porosity for given process conditions, as it will be discussed later in section 3.2. An obvious limitation of the microscopic method is the local aspect of the measure: it only allows quantifying the porosity in the area of the sampleŌĆÖs section observed. This could be misleading at times and a statistical analysis over several sections would be more appropriate at the expense of labor time. This is why it is recommended to combine both buoyancy and microscopic methods. This is the approach described in the present paper. Schematics of both the buoyancy and microscopic methods are given in Fig. 3 for more clarity47).

2.5 Experimental and analyses procedure
1 cm3 specimens were produced by SLM (METALSYS 150) by Winforsys Information Technology Co., Ltd. as described in section 2.4 and separated from the base plate by wire cut electrical discharge machining. The samples were then shipped to the MS&E department of Changwon National University for complete analysis. The density of each sample was first calculated according to the buoyancy method. Samples were roughly ground on each side to remove external roughness. The mass in air and in distilled water was then measured at ambient temperature using a high precision balance (SciLab WBA-320) and a density kit. The density kit consisted in a beaker filled with approximately 250 mL distilled water, a density pan, a density pan holder and a beaker stand. The density pan, density pan holder and beaker stand were conveniently designed and fabricated in polymer by DLP processing (photopolymerization- based AM). The measure was repeated at least five times for statistical purpose and the average value of the samples density was calculated according to Eq. (2).
The samples were then sectioned in half in cross section (along the building direction) and hot mounted in a phenolic conductive resin with carbon filler (Struers PolyFast) using an auto mounting press (MTDI MM-100). The mounted specimens were subsequently ground using abrasive SiC papers from grit 400 to 2000 and polished using appropriate cloths and diamond pastes from 9 ╬╝m down to 1 ╬╝m. They were then thoroughly washed in ethanol using an ultrasonic cleaner (DAIHAN WUC-A10H) for 20 min at ambient temperature. This allowed to obtain a smooth highly reflective surface. Several optical micrographs were taken at x50 magnification (Nikon EPIPHOT 200) covering the entire sample and were subsequently stitched together into one single image of high quality showing the entire cross section. Such a micrograph shows the dense material in white (reflecting the OM white light) and the pores in black. Using an image analysis software (Image-Pro Plus 6.0), it was therefore easy to quantify porosity in terms of volume fraction by calculating the ratio of pores area over the entire section area according to Eq. (3).
To reveal the microstructure, the samples were electrolytically etched with a solution of (1 dist. water : 1 HNO4), a voltage of 12-14 V and a current of approximately 20 A. The surface of the samples was tipped for about 5 s in three to five positions. Optical micrographs were taken various magnification. The microstructure and composition was also evaluated by SEM-EDS (JEOL JSM- 5800 operating at 20 keV) for selected specimens.
Finally, hardness was measured using a digital Rockwell hardness tester (Samil Precision Co. SR-300) with a 150 kg load. Hardness was measured in five points of a sample (four corners and at the center of the cross section) and the average values of hardness were used.
3. Results and discussion
3.1 Density analysis
After production by SLM of CoCr-Mo specimens according to the schematic in Fig. 2, the density of each specimen was calculated by buoyancy method according to Eq. (2). Fig. 4(a) shows the average values of the calculated density as a function of the energy density (Eq. (1)) corresponding to the process parametersŌĆÖ sets. In Fig. 4(b) however, the calculated density was plot as a 3D color map as a function of the scanning speed and the laser power. Fig. 4(a) clearly shows there is a trend as to the relationship between density (or porosity) and energy density of the process: generally speaking, increasing the energy density increases the density or reduces the porosity of the parts. This is intuitive as the higher the energy density the more consistent the melting and therefore the consolidation. However, although it is not highlighted in the present case, it is often referred to a processing window as there is an upper bond for the energy density. A too high energy density may cause significant defects such as turbulent melt pool, evaporation of light elements, boiling, sputtering, high residual stress, microcracking, etc. Although the results exhibited in Fig. 4(a) are valuable, the effect of individual parameters is not evidenced. This is noted by several conditions exhibiting similar values of energy density though the parts densities are significantly different. This indicates that although a minimum energy density of about 100 J.mm-3 seems appropriate from Fig. 4(a) for maximizing density, any combination according to Eq.(1) may not be satisfactory. This is highlighted in Fig. 4(b) where the individual effect of the scanning speed and the laser power can be assessed. It is shown that the effect of the laser power is clearly more important, although at low power the effect of the scanning speed is significant. The plot in Fig. 4(b) suggests that the laser power should be higher than 120 W.
Fig.┬Ā4
Density measured by buoyancy method and calculated according to Eq. (2) for all CoCr-Mo specimens. (a) is the density as a function of the energy density (Eq.(1)) and (b) is the density as function of the scanning speed and laser power

As mentioned previously, the analysis of the density as a function of the processing conditions is clearly valuable as it is a simple non-destructive method which allows obtaining information regarding the entire parts volume. However, it doesnŌĆÖt give valuable information about the nature of porosity itself. In other words, while it is clear that density and porosity are inversely proportional, the nature of porosity is unknown. Besides, it is difficult to accurately quantify porosity based on density measurements as it is difficult to know with precision the theoretical density of the alloy under study which is very sensitive to the chemical composition and microstructure.
3.2 Porosity analysis
The porosity of the as-built parts was measured by microscopy analysis as described in section 2.5. Fig. 5 shows the porosity of all 16 CoCr-Mo samples along with the actual value of porosity in percent measured on the specific cross section. Similarly to density analysis, Fig. 6(a) shows the average values of the calculated density as a function of the energy density while Fig. 6(b) shows porosity plot as a function of the scanning speed and the laser power.
Fig.┬Ā5
Optical micrographs showing the porosity of all specimens produced by SLM according to the experimental design. The value of porosity in percent is included for each specimen in red
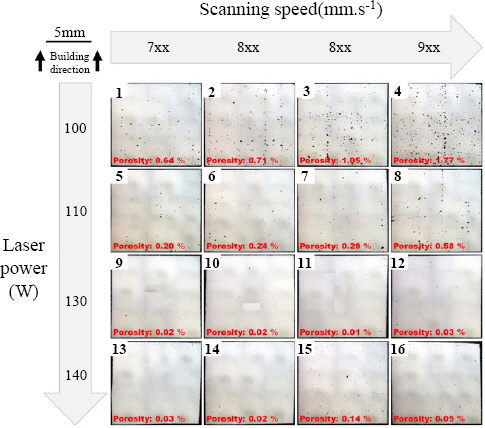
Fig.┬Ā6
Porosity measured by microscopic method and calculated as the ratio of pores area over the sampleŌĆÖs cross section area for all CoCr-Mo specimens. (a) is the porosity as a function of the energy density (Eq.(1)) and (b) is the porosity as function of the scanning speed and laser power

The results of the porosity analysis by microscopy are consistent with the density analysis in the previous section 3.1: the porosity is basically inversely proportional to the energy density (Fig. 6(a)). The significant role of the laser power over the scanning speed is once again highlighted by Fig. 6(b). The obvious limitation of the results in Fig. 6, inherent to the microscopy method, is that the porosity is measured only on the considered cross section. The risk for statistical error is rather high, which motivates the combination of both the density and microscopy methods. An incremental grinding and polishing procedure could be used to lessen this, however to the expense of consequent time and labor. Besides, the average size of porosity is usually smaller than any conceivable incrementing. The great advantage and complementary outcome however is the ability to actually observe porosity (Fig. 5). There are several identified kinds of porosity15,24,27,32,33,43).
First, ŌĆ£powder porosityŌĆØ is often found and identified as small spherical pores randomly located. These are found in the starting powder and usually are caused by gas trapped during the gas atomization process for powder production. Although some of these pores will be released during the selective melting, little can be done in this regard from the processing stand point. Nevertheless, this powder porosity is small in volume (obviously smaller than the larger particle size) and spherical therefore not leading to notch effects. For these reasons, they are not significantly detrimental to the properties of the material.
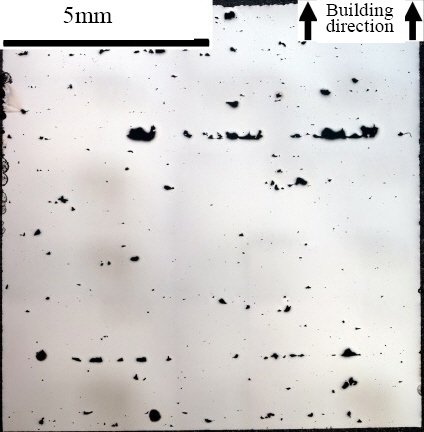
The second kind of frequent porosity can be observed somewhat elongated and aligned along the layer deposition direction, often at layer interfaces. This porosity usually arises from inconsistent consolidation between adjacent layers. Several reasons can be responsible such as inappropriate combination of layer thickness and laser power, inappropriate energy density value, inappropriate powder characteristics in particular packing density or flowability, inappropriate racking mechanism. A clear example of such porosity is given in Fig. 7 for an Alloy 718 produced by SLM. This 1 cm3 specimen shows a porosity of 1.68 % (measured density of 8.06 g.cm-3) for a calculated energy density of 82.3 J.mm-3. Very large pores are clearly observed along the layer deposition direction. This type of porosity can be referred to as ŌĆ£layer porosityŌĆØ.
Fig.┬Ā7
Optical micrograph of an Alloy 718 produced by SLM (P = 200 W, ╬Į= 900 mm.s-1, t = 30 ╬╝m and h= 90 ┬Ąm ; Ed= 82.3 J.mm-3) exhibiting a rather high porosity of 1.68 %. Large pores elongated and aligned along the layer deposition direction can clearly be observed, corresponding to ŌĆ£layer porosityŌĆØ
The third kind of commonly observed porosity is referred to as ŌĆ£hatch porosityŌĆØ. It can be identified as irregular pores aligned along the building direction. This type of porosity is clearly observed in low power specimens in Fig. 5 (samples 1 to 8 corresponding to laser of 100 W and 110 W). As in the present case, such porosity can be observed at islands or stripes boundary in correspondence to the building strategy. Note in the case of Fig. 5 that in these specific cross sections, the islands corresponding to the building strategy in the present investigation were cut along random planes. It is however evident from the micrographs that a significant cause of porosity in these samples were the islands boundaries. This type of porosity can be referred to as ŌĆ£hatch porosityŌĆØ as it is caused by inconsistent consolidation between adjacent melting tracks in the layer plane.
There is finally more irregular porosity, referred to as ŌĆ£random porosityŌĆØ. These are more unpredictable and are caused by occasional events such as agglomerated powders, inconsistent protective flow, layer deposition failure, etc.
Although redeemable to some extent as previously suggested, powder porosity is the only source of porosity which canŌĆÖt be dealt with solely by process optimization. The other sources of porosity - baptized layer, hatch and random porosity - are directly related to the SLM process conditions and therefore can virtually be completely eliminated. This is the reason why excellent density, or very low residual porosity, can be achieved by SLM and powder bed AM in general. This is highlighted by the present case study where specimens produced with higher laser power (samples 9 to 16 corresponding to laser of 130 W and 140 W) exhibited very low residual porosity well under 0.1%, with mostly traces of only small spherical pores attributed to the powders.
3.3 Microstructure
The microstructure of SLM built parts is very specific to this processing method. SLM and more generally powder bed fusion AM processes can be viewed as a micro-welding process, in which selective parts of a powder bed are quickly melted and solidified to join adjacent tracks and superposing layers. The process is usually characterized by fast solidification and cooling rates in the order of 104 to 106 K/s10,14-16,19,21,23,28,31,36).
This gives rise to a nanodendritic microstructure usually showing high hardness and strength. The very rapid cooling also generates a large number of dislocations in the material which, together with rapid heat cycles, causes high residual stress in the as-built parts. Also due to the nature of the process, the microstructure often exhibit columnar grains along the building direction as a results of remelting of the underlying substrate, according epitaxial solidification and direction of the heat transfer13,15,18,19,21-23,25,27,31,35,43). The process parameters do have a significant influence on the microstructure, and although only optimization through density optimization is presented here, microstructure should also be considered as a critical response. For example, the solidification and cooling rates are strongly affected by the scanning speed. As intuitively understood, the faster the scanning speed the larger the solidification and cooling rates.
Similarly to Fig. 5, the low magnifications of the microstructure of all 16 samples are shown in Fig. 8. The characteristic ŌĆ£fish-scaleŌĆØ aspect of the melt pools is clearly visible. Although not clear in Fig. 8, some typical defects could be identified such as unmelted powder particles and microcracking. The microstructure of sample 11 is given in Fig. 9 for reference. In the optical micrographs in Fig. 9(a) and 9(b), one can note the melt pool depth is larger than 50 ╬╝m therefore appropriately remelting the underlying substrate (layer thickness t = 20 ╬╝m). Similarly, the melt pool width is approximately 100 ╬╝m therefore appropriately overlapping adjacent laser tracks (hatch spacing h = 70 ╬╝m). Although not clear in Fig. 9(b), the fine dendritic structure with columnar grains intercepting several melt pools is apparent. This is more evident from the SEM micrographs in Figs. 9(c) and 9(d).


3.4 Hardness
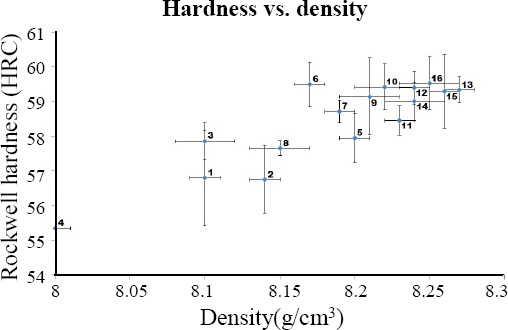
Fig. 10 shows the Rockwell hardness of all 16 CoCr- Mo samples along with the actual measured average values of hardness. Similarly to density and porosity analyses, Fig. 10(a) shows the average values of hardness as a function of the energy density while Fig. 10(b) shows hardness plot as a function of the scanning speed and the laser power. It should also be noted that the values of hardness measured for all specimens, and particularly those showing the highest density, largely exceed the ASTM F75 requirements of 25 ~ 35 HRC46). This is due as previously mentioned to the very low porosity, the very fine dendritic microstructure and the high density of tangled dislocations. The results of hardness are consistent with those on density and porosity. This indicates that although microstructure may slightly differ from one sample to another as a result of different processing conditions, the role of porosity is decidedly more significant on mechanical properties. This was highlighted in Fig. 11 where the measured hardness was plot as a function of the corresponding density for all 16 samples.
Fig.┬Ā10
Rockwell hardness for all CoCr-Mo specimens measured in five locations and averaged. (a) is the hardness as a function of the energy density (Eq.(1)) and (b) is the hardness as function of the scanning speed and laser power
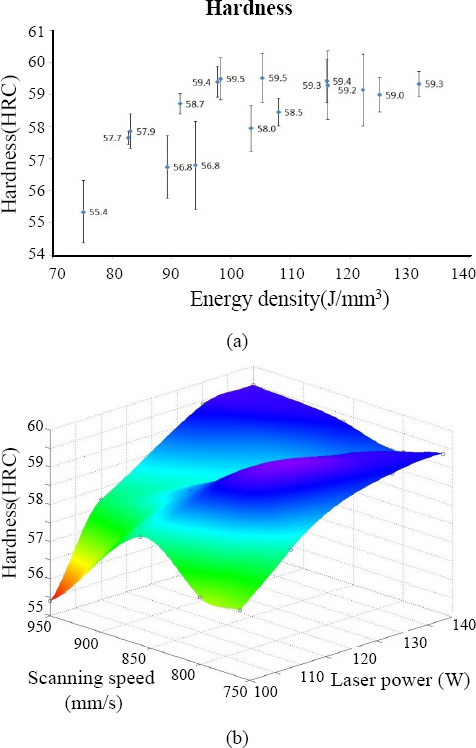
Fig.┬Ā11
Rockwell hardness for all 16 CoCr-Mo specimens plot as a function of the measured density by buoyancy. The label of the specimen according to Fig. 2 was inserted for reference
4. Conclusion
The present paper describes the general method for process parameters optimization based on the response surface methodology for the production of high quality parts and products by Selective Laser Melting, a popular powder bed Additive Manufacturing process. This optimization method consists in producing various specimens of a specific alloy with a specific equipment by varying the key parameters according to a designed matrix and record one or several response(s) characteristic of the as-built material. As an example to illustrate such optimization campaign, a CoCr-Mo alloy was produced with a Winforsys Information Technology Co., Ltd. METALSYS 150 equipment. The laser scanning speed and power were varied and the porosity and hardness were measured for all 16 combinations. This allowed determining an appropriate processing window and in particular the significant effect of the laser power. With considerations on density, properties, processability and production, a high laser power of P Ōēź 120 W and high scanning speed of ╬Į = 850~950 mm.s-1 seemed appropriate (layer thickness t = 20 ╬╝m, hatch spacing h = 70 ╬╝m and island scanning strategy) corresponding to an energy density Ed = 90~120 J.mm-3. In these conditions, the CoCr-Mo alloy exhibited a very fine dendritic microstructure with columnar grains along the building direction. The materials were characterized by high density Ōēź 8.25 g.cm-3, absence of process porosity and the hardness Ōēź 59 HRC was significantly higher than the requirements for such alloy. The optimization method described in the present paper is highly valuable and should systematically be implemented for producing high quality products by Selective Laser Melting.
 PDF Links
 PubReader
 ePub Link
 Full text via DOI
 Download Citation
 Print
Print